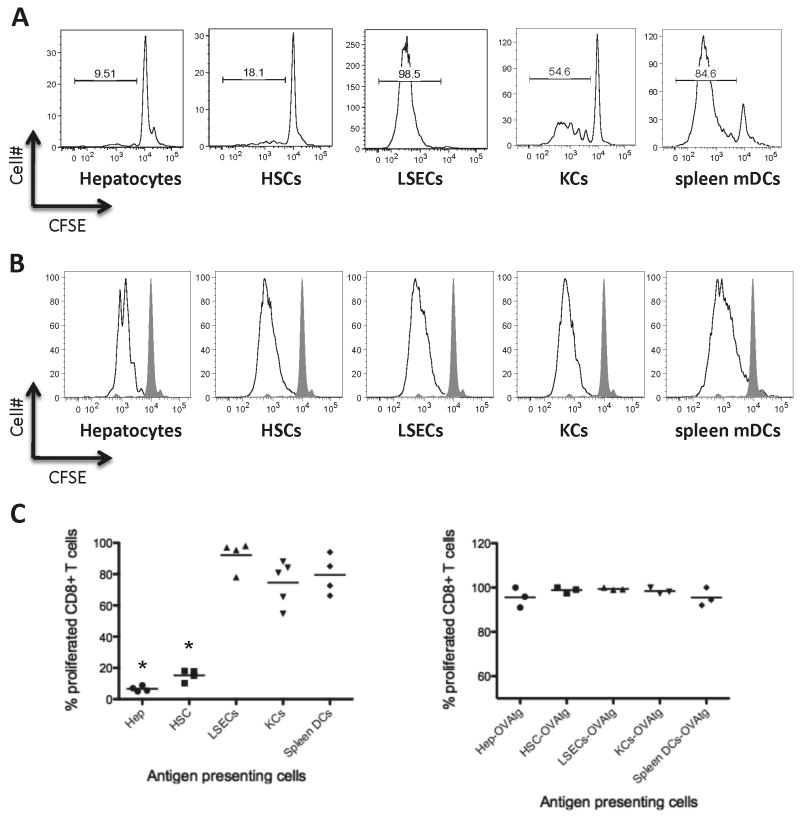
Figure 2. Cross-presentation of exogenous soluble ovalbumin protein or direct presentation of endogenously expressed ovalbumin.
A. Representative figure showing CFSE dilution following cross-presentation of soluble OVA by different subsets of liver APCs as well as spleen mDCs as positive controls. There was a clear hierarchy when antigen was soluble. LSECs were the best APC in induction of CD8+ T cell proliferation. KCs could induce a substantial level of proliferation; however, they were less efficient than LSECs. HSCs and hepatocytes were not efficient in this condition. B. Representative figure showing CFSE dilution following direct presentation of OVA using cells from OVA-transgenic mice. All APCs induced CD8+ T cell proliferation efficiently when comparing to control cultures of CD8+ T cells without APCs (shaded graph). C. Data from 3-5 separate experiments showing percent of proliferated OT-I T cells following soluble antigen cross presentation (left plot) or direct presentation of a transgenic antigen (right plot). Each data point represents an independent experiment. *P<0.01 different from spleen mDCs, which were positive controls.

