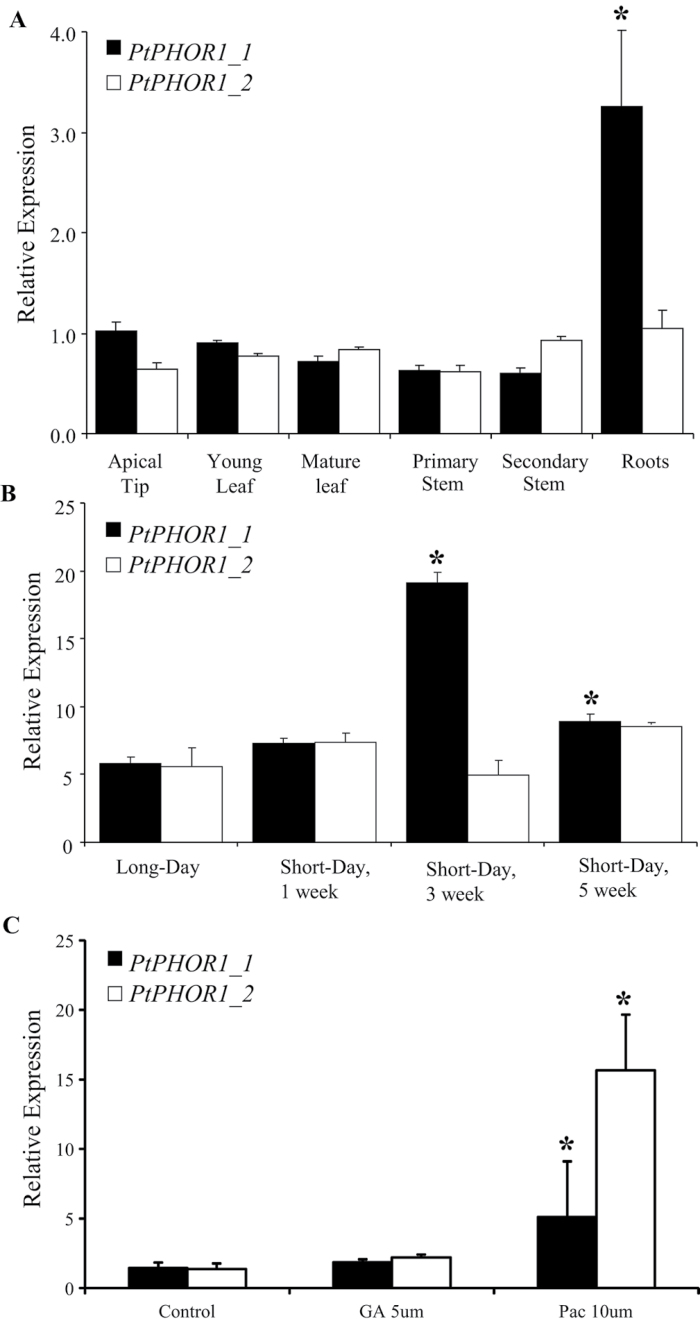
Fig. 2.
Expression of PtPHOR1 genes in wild-type poplars. Expression was studied in 3-month-old 717-IB4 tissues (A) and leaves subjected to short-day treatment (B). Bars represent mean ± SE for reverse-transcription PCR results normalized to UBQ and CYC. In (A), means are based on three biological replicates: young leaf, leaf-plastochron index=4–7 and expanding; mature leaf, leaf-plastochron index=15 and fully expanded; primary stem, leaf-plastochron index=2–6 and undergoing primary growth; secondary stems, leaf-plastochron index=15–18 and undergoing secondary (woody) growth and roots, soft non-lignified tips. In (B), expression in plants grown under long days (16/8 light/dark) compared to plants that were subsequently subjected to short days (8/16 light/dark) for 1, 3, and 5 weeks; means are based on two biological replicates (each composed of three technical replicates) on pooled leaf samples (leaf-plastochron index=7–10) collected from five wild-type plants. In (C), hormonal treatments are described in the Materials and methods (GA, gibberellin; Pac, paclobutrazol). All treatments were performed with at least two biological replications. Asterisks indicate significant difference (P < 0.05) by ANOVA followed by Tukey′s post-hoc test (A), t-test between long-day and short-day values (B), and t-test between control and treatment (C).

