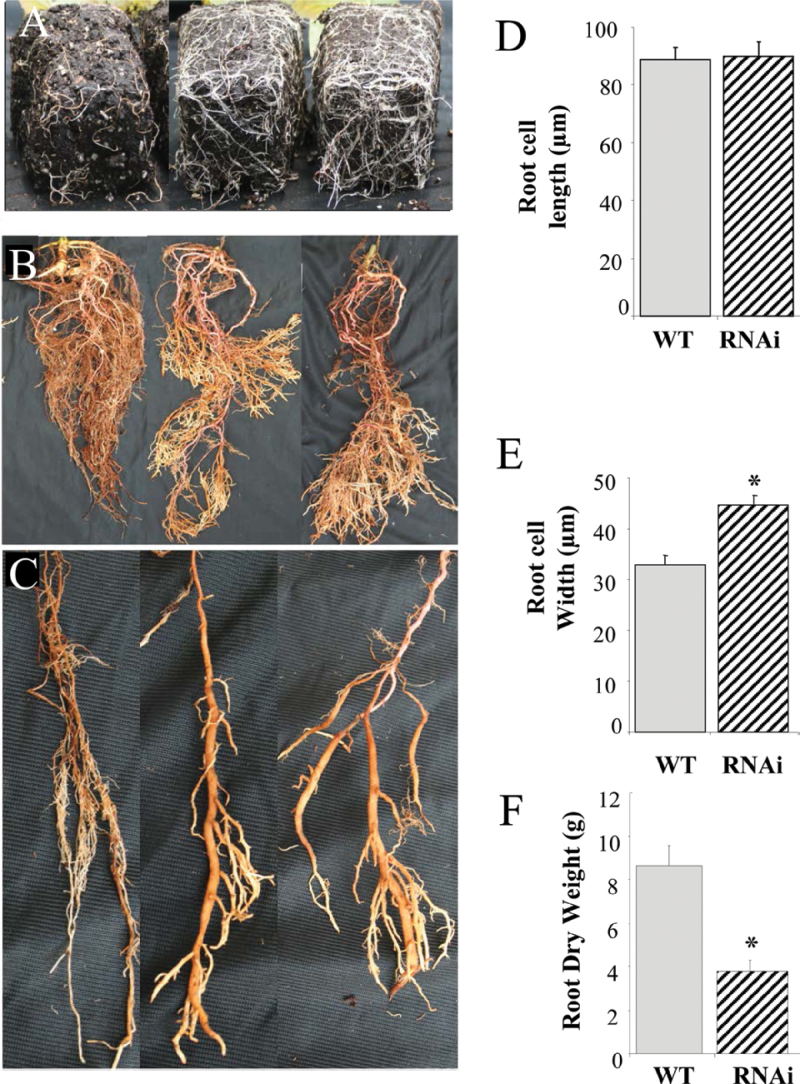
Fig. 6.
Downregulation of PtPHOR1 changed root architecture. (A–C) Altered root morphology of PtPHOR1 RNAi transgenics after 45 days (A) and 90 days (B and C) in a greenhouse; representative wild-type (WT, left) and transgenic roots (middle and right). (D, E) Root cortex cell length (D) and width (E) measured 2mm from the root tips on radial sections of two RNAi lines, with three ramets each, and three WT plants. (F) Root dry weight of two RNAi lines, each with at least four ramets and 10 WT plants. Bars represent event mean ± SE. Asterisks indicate significant difference (P < 0.05) from WT as determined by ANOVA followed by Dunnett′s post-hoc test (this figure is available in colour at JXB online).

