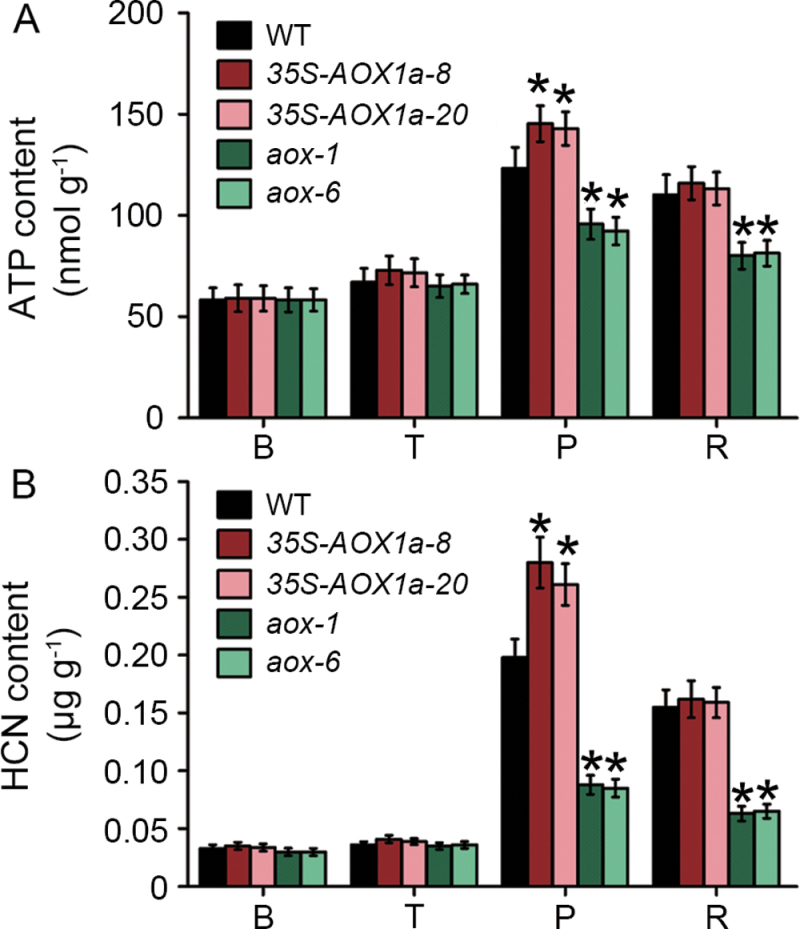
Fig. 8.
Changes in the ATP (A) and HCN (B) levels during ripening in wild-type (WT) and transgenic tomatoes. Data are the means ±SD of three independent experiments. The asterisks indicate statistically significant differences between the WT and transgenic fruit (P < 0.05). B, breaker stage; T, turning stage; P, pink stage; R, red stage.

