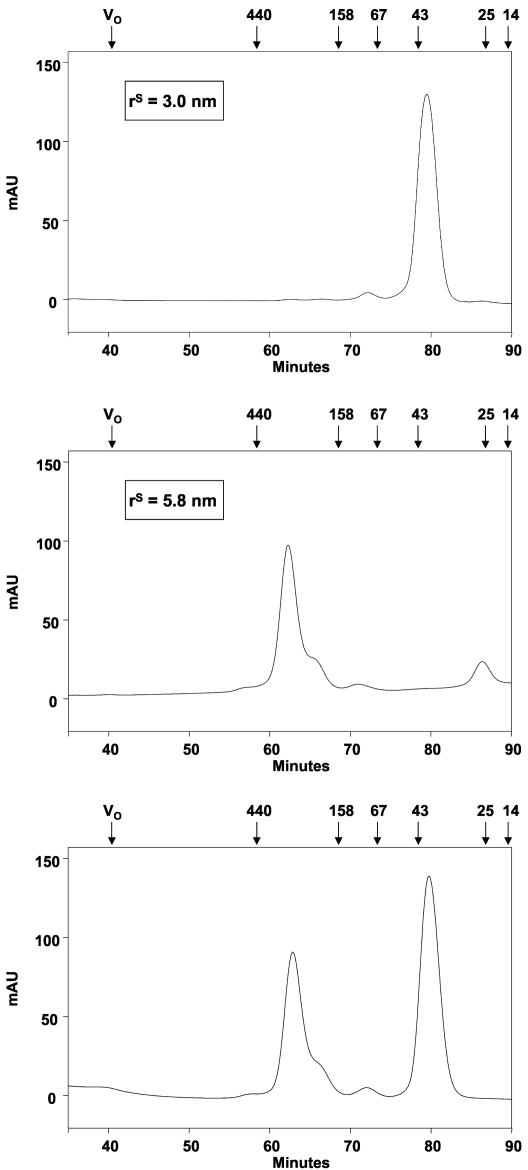
FIG. 3.
Gel filtration analysis of MBP and MBP-rep. (Upper and middle panels) The mobility of MBP (upper panel) and MBP-rep (middle panel) during gel filtration yielded rS values for each protein. (Lower panel) Migration of the two proteins when they were subjected to gel filtration as a 1:1 mixture. The molecular masses (in kilodaltons) and elution times of the standard proteins are indicated at the top in each panel. mAU, milliabsorbance units.

