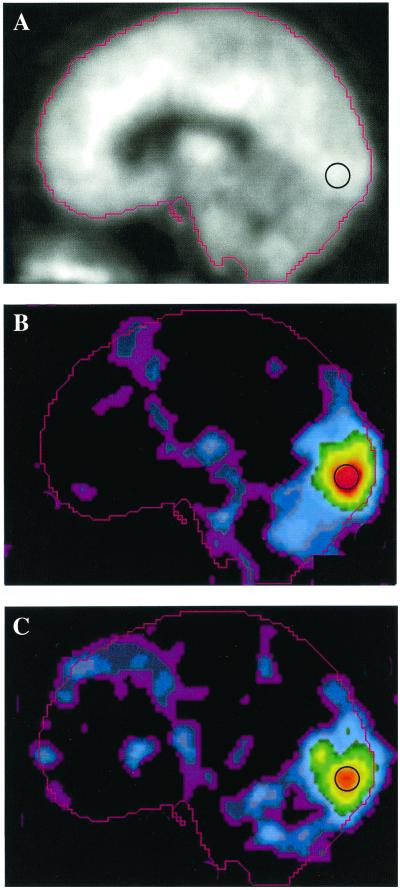
Figure 3.
Blood flow images displayed as a midsagittal slice after averaging subject data in a standard atlas coordinate system. Image data were derived from quantitative PET blood flow scans that were normalized for variations in global blood flow. Each of nine subjects underwent scanning in two blocks: one block during breathing room air and a second block during hypoxia induced by reducing the inspired O2 fraction. In each block, PET studies were done during two control tasks and two visual activation tasks. (A) Average blood flow image from the control scans. (B) Mean subtraction image (visual activation minus control task) while breathing room air. (C) Average subtraction (visual activation minus visual fixation) image during hypoxia scaled to the same maximum as B. The black circle illustrates the relative size and position of the spherical region-of-interest used for quantitation of the regional visual cortex CBF. Note similarity in magnitude and distribution of the increased blood flow during visual activation. No augmentation of the blood flow response is seen despite the presence of reduced arterial oxygen content.

