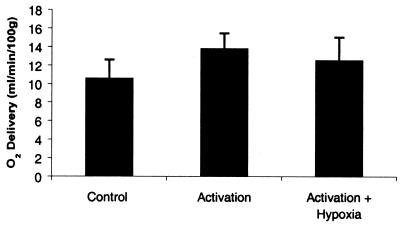
Figure 4.
Effect of visual activation and hypoxia on visual cortex oxygen delivery. The regional oxygen delivery was calculated from the product of the subject's arterial oxygen content and PET-measured regional CBF. The data shown represent the mean and standard deviation of nine subjects (with each subject value representing the mean of two measurements in each of the four states). Oxygen delivery during activation + hypoxia was significantly less than oxygen delivery during activation alone (P < 0.05), demonstrating the lack of compensatory increase in CBF.

