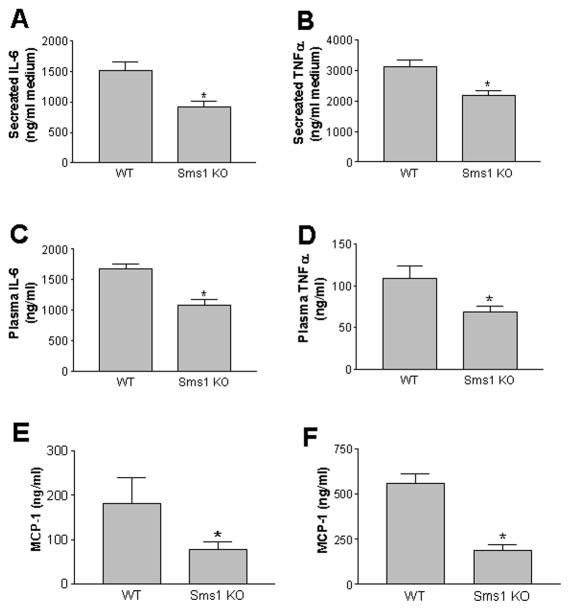
Figure 4.
Cytokine and chemokine measurement in macrophage medium and mouse plasma. Panel A and B, IL6 and TNFα in macrophage medium after LPS treatment; Panel C and D, IL6 and TNFα mouse plasma after LPS treatment; Panel E, MCP-1 levels in mouse plasma without LPS treatment. Panel F, MCP-1 levels in mouse plasma after LPS treatment. All cytokine and chemokine were analyzed by ELISA. Results are representatives of 6 animals in each group. Values are mean ± SD, n=6, * P<0.01

