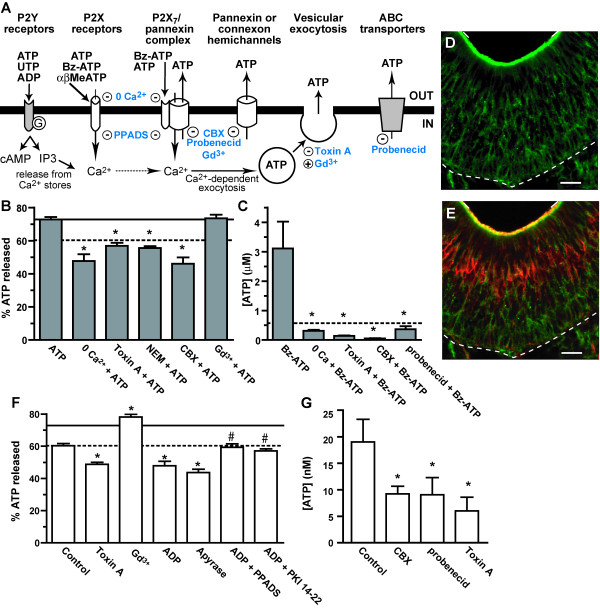
Figure 3.
Mechanisms of ATP release. (A) Schematic of the possible mechanisms of ATP release investigated in this study. Extracellular ATP, leaking from damaged cells or released constitutively, activates both P2Y and P2X purinergic receptors, leading to increases in intracellular Ca2+ and Ca2+-dependent exocytosis. ATP activated P2X7 receptors may form a complex with pannexin hemichannels through which ATP can efflux. ATP release may also occur through pannexin/connexin hemichannels or ATP binding cassette (ABC) transporters. Pharmacological inhibitors (−) and stimulators (+) are indicated in blue. (B-C) Measurement of agonist-evoked ATP release. (B) Mean (+ SEM) % of released ATP measured from Z-stack recordings after application of ATP (50 μM) following incubation in Ringer’s solution (ATP), media lacking extracellular calcium (0 Ca2+ + ATP), non-specific pannexin and activated P2X7 receptor inhibitor carbenoxolone (100 μM, CBX + ATP), vesicle fusion inhibitors Clostridium difficile toxin A (30 min,1 nM, Toxin A + ATP) and N-ethylmaleimide (500 μM, NEM + ATP), or vesicular release stimulator and pannexin and connexin hemichannel inhibitor gadolinium chloride (50 μM, Gd3+ + ATP). *, p < 0.001 v. ATP, one-way ANOVA with Bonferroni’s planned comparison test. Mean ATP value indicated by solid line; mean control value (see Figure 2F) indicated by dashed line. (C) Luciferin-luciferase assays were used to quantify the amount of ATP released (mean + SEM) following application of 50 μM P2X1,7 receptor agonist Bz-ATP in calcium-free solution (0 Ca2+ + Bz-ATP), carbenoxolone (100 μM; CBX + Bz-ATP), selective pannexin 1 channel and ABC transporter inhibitor probenecid (500 μM), or Clostridium difficile toxin A (30 min, 1 nM; Toxin A + Bz-ATP). *, p < 0.01 v. Bz-ATP, one-way ANOVA with Bonferroni’s planned comparison test. Dashed line indicates the mean concentration of ATP measured when 50 μM Bz-ATP was used in the assay in the absence of tissue. (D-E) Immunoreactivity of synaptosomal associated protein SNAP-23 (green; D,E) and olfactory marker protein, a marker for neurons (red; E). Dashed line, basal lamina; solid line, apical surface of OE. Scale bar: 20 μm. (F-G) Measurement of constitutive ATP release. Confocal Z-stack imaging of quinacrine fluorescence (F) and luciferin-luciferase assays (G) were performed to quantify constitutive ATP release following incubation with Ringer’s solution (Control), or various inhibitors: Clostridium difficile toxin A (30 min; 1 nM; Toxin A), gadolinium chloride (50 μM; Gd3+), probenecid (500 μM), carbenoxolone (100 μM; CBX), ectonucleotidase apyrase (1 h; 3 units/ml), P2Y1,6,12,13 agonist ADP (50 μM), non-selective purinergic receptor antagonist PPADS and ADP (5 min; 25 μM and 50 μM, respectively), or PKA inhibitor protein kinase inhibitor fragment 14–22 (PKI 14–22) and ADP (1 hour; 10 μM and 50 μM, respectively). Data reported as described above in Figure 3 B-C. *, p < 0.05 v. Control; #, p < 0.001 v. ADP, one-way ANOVA with Bonferroni’s planned comparison test.

