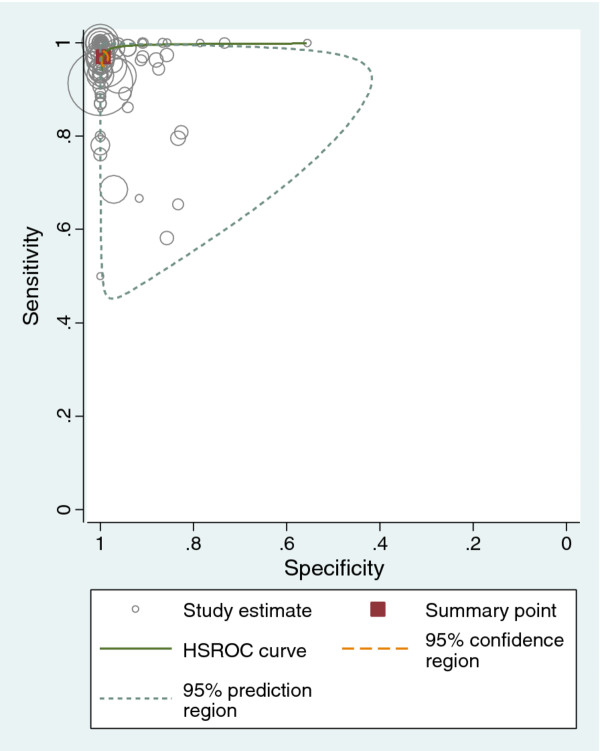
Figure 3.
ROC plot of sensitivity against (1 − specificity) for 90 studies of the diagnosis of fetal sex by cffDNA. Each point on the graph represents a pair of sensitivity and specificity from a study. The more weight the study is given, the larger the point. Summary sensitivity and specificity is marked by a red square.

