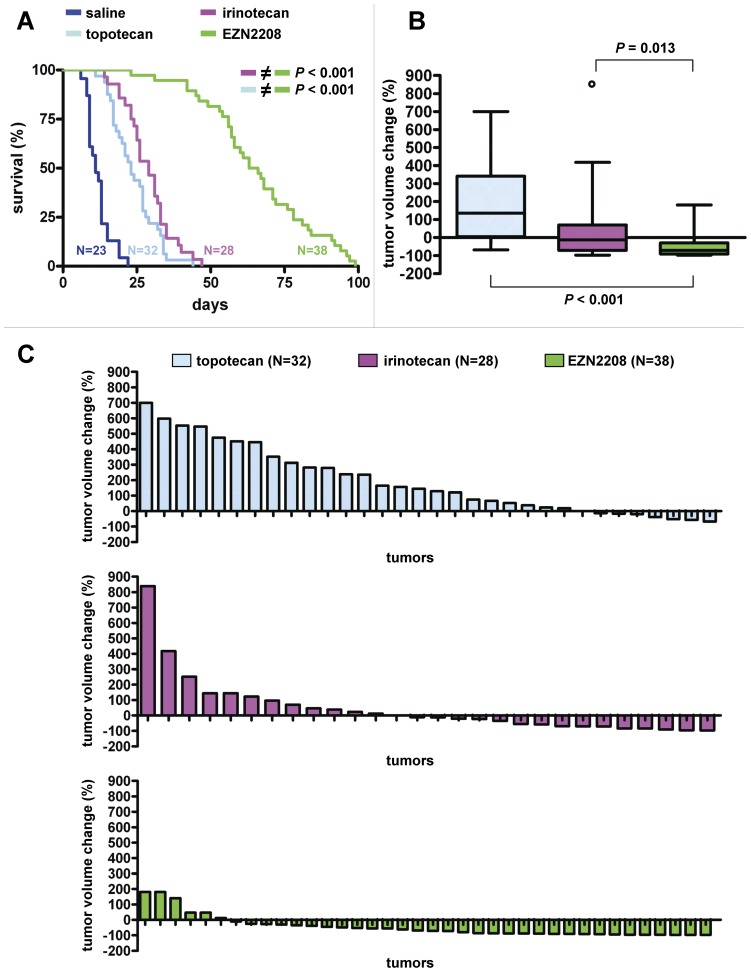
Figure 4. Efficacy of topotecan, irinotecan and EZN-2208 in five ABCG2-positive Brca1−/−;p53−/− mammary tumors.
A, K–M curves showing survival (%) until a tumor volume of about 1500 mm3 was reached after one regimen of five consecutive i.v. injections on days 0, 2, 4, 6 and 8 of saline- (dark blue line, N = 23), topotecan- (light blue line, 4 mg i.v., N = 32), irinotecan- (pink line, 40 mg i.v., N = 28) and EZN-2208-treatments (green line, 10 mg SN38 equivalents i.v., N = 38) per kg body weight. P values were calculated using the Log-rank test. B, Box and whiskers plots indicating per drug the tumor volume change (%) after two weeks of treatment. Lines represent the median response, while the whiskers show the maximum and minimum values; the small circle is an outlier. P values were calculated using the Mann Whitney test. C, Waterfall plots showing tumor volume change (%) after two weeks of treatment per individual mouse, with relative volumes normalized to the treatment start volume.

