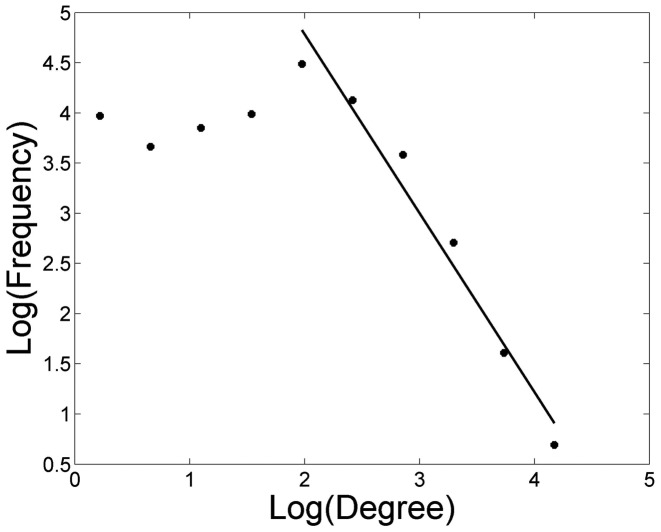
Figure 3. The degree distribution of the trait-pathway network.
Axes are in natural base log scale. The network degree (number of interactions with other pathways) of pathways was log transformed and allocated into 10 evenly spaced bins. Plotted are the frequency counts in each bin against the bin center value.

