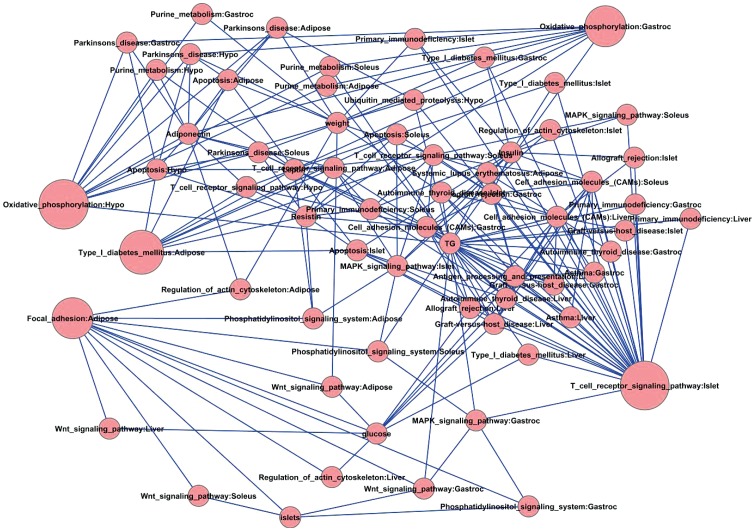
Figure 6. Trait-pathway network for the BTBR obese 10 week mice.
Nodes are the quantitative traits and pathways with FDR<0.3 and their first-degree neighbors. Node sizes are defined by the enhancement significance of node degree (5th column, p-value, of Table 8).

