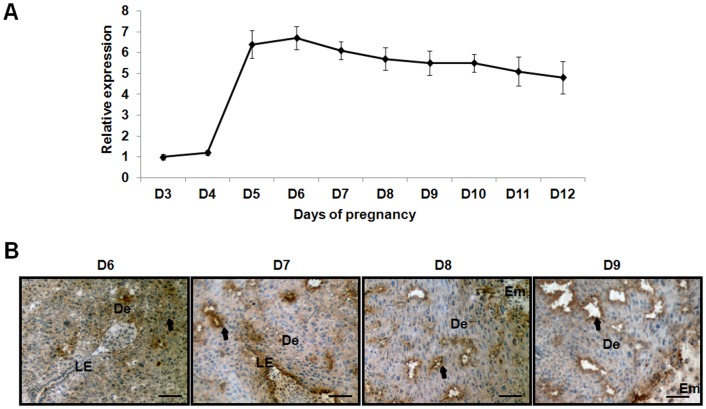
Figure 1. The expression of IGFBP7 during the post-implantation period.
A: The expression of IGFBP7 in uteri from D3 to D12 of pregnancy. The vertical axis represents the relative expression of IGFBP7 normalized to internal control GAPDH. The expression of IGFBP7 was found to be dramatically elevated and was maintained at a relative high level after D5 of pregnancy. B: In situ expression of IGFBP7 in uteri from D6 to D9 of pregnancy. The brown staining represents positive signals for IGFBP7. IGFBP7 was expressed in the glandular epithelium and stroma. Bar represents 250 µm. LE: Luminal epithelium; De: Decidua; Em: Embryo.

