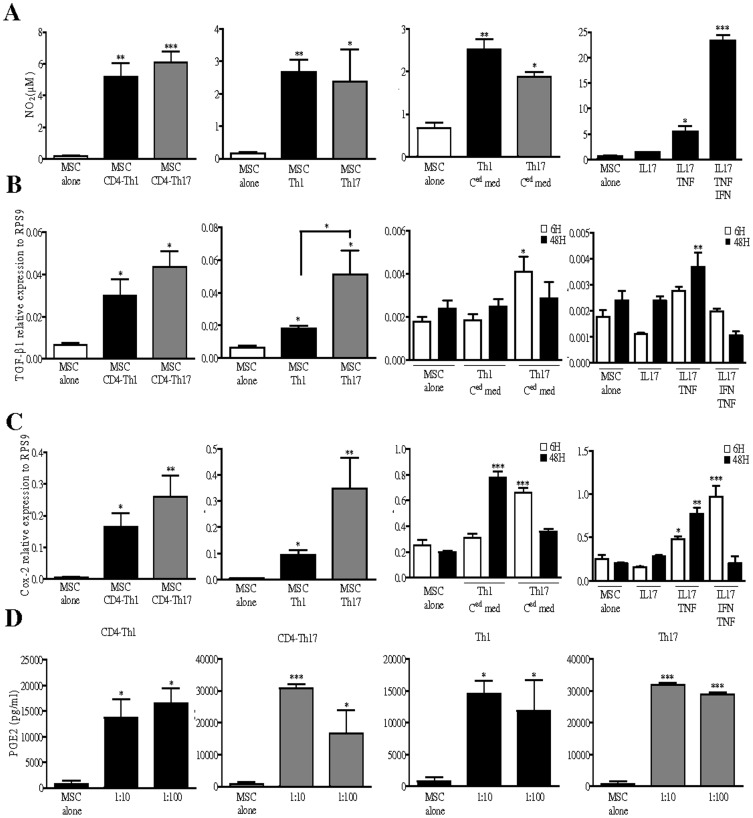
Figure 2. Th1 and Th17 cells up-regulate NO, TGF-β1 and Cox2 expression levels in MSC.
(A) Quantification of NO2 using a modified Griess reagent and (D) PGE2 secretion by ELISA. Levels of NO2 and PGE2 were quantified in the supernatants of MSC co-cultures with either T cells induced to differentiate toward Th1 or Th17 lineages (CD4-Th1 and CD4-Th17) or with mature Th1 and Th17. (A) Quantification of NO2 in the supernatant of MSC treated for 48 hours with Th1- or Th17-conditioned media. T-cell-conditioned medium (Ced med) were obtained from a 3-day culture of either differentiated Th1 or Th17 cells. Quantification of NO2 in the supernatant of MSC treated during 48 hours with IL-17 alone or in combination with either TNF-α or TNF-α and IFN-γ. (D) PGE2 was quantified in the supernatant of T cells co-cultured with MSC (MSC:T cell ratios 1∶10 and 1∶100). (B) Evaluation of TGF-β1 and (C) Cox-2 expression levels by quantitative real time PCR. (B and C) mRNA was extracted from MSC after co-culture with CD4+ T cells undergoing Th1 or Th17 lineages or with mature Th1 or Th17 cells. (B) TGF-β1 and (C) Cox-2 expression levels were quantified in MSC after a 6 or 48 hours treatment with Th1- or Th17-conditioned media. (B) TGF-β1 and (C) Cox-2 expression levels in MSC were also assessed after a 6 or 48 hours treatment with IL-17 alone or in combination with either TNF-α or TNF-α and IFN-γ. If not indicated, P values referred to the condition when MSC are cultured alone (MSC alone).

