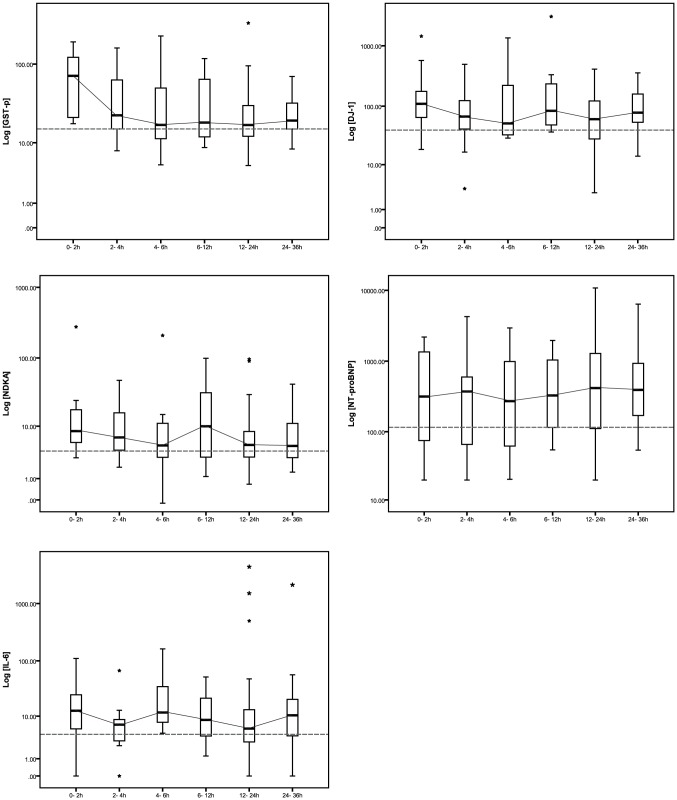
Figure 1. Time course of the blood concentrations of GST-π, NDKA, DJ-1, NT-proBNP and IL-6 after stroke onset.
The grey dashed lines correspond to the median concentration of the molecules in the control patients. The grey lines connect the median of the box plots. 0–3 h: N = 22, 3–6 h: N = 15, 6–12 h: N = 8, 12–24 h: N = 45 and 24–36 h: N = 13. Note that there is no overlap between the different subgroup of times and that each patient has only one blood sampling within the 36 h after stroke onset.

