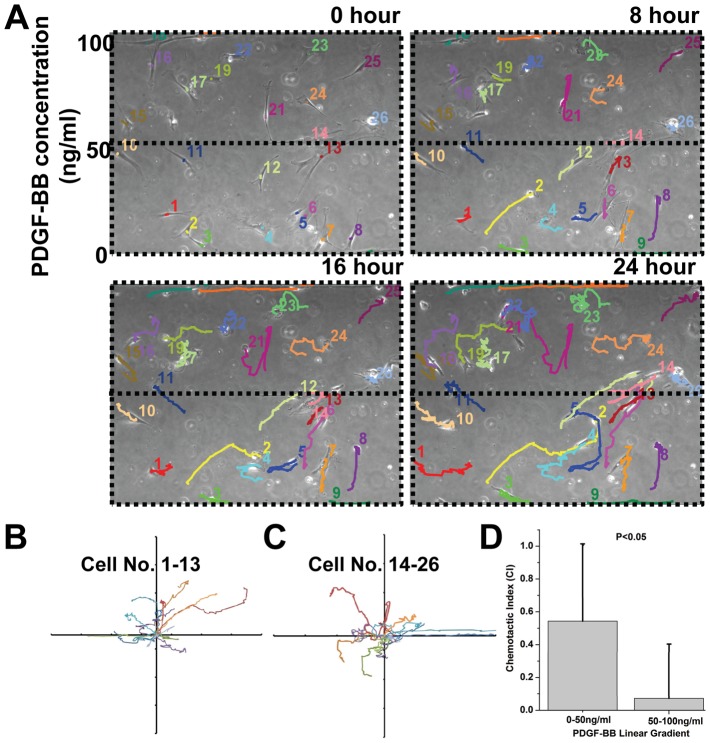
Figure 3. Microfluidic platform for short-term chemotaxis assay.
(A) Time-lapse images of MSCs migration under a PDGF-BB gradient for 24 hours. Images were taken every 15 minutes and individual color-coded cell tracks were assembled after 0, 8, 16, and 24 hours. A movie clip of the 24-hour cell migration data is available (Mov. S1). (B, C) Migration traces of cells initially seeded in the lower PDGF-BB concentration region (cell no. 1-13) and in the higher PDGF-BB concentration region (cell no. 14-26), respectively. These cell traces (B) indicate that cells in the bottom half of the channel (0–50 ng/mL of PDGF-BB) exhibited directed migration, whereas (C) cells in the top half of the channel (50–100 ng/mL of PDGF-BB) exhibited random motion. Axes are in the units of 200 microns. (D) Chemotactic index, CI of MSCs in 0–50 ng/ml and 50–100 ng/ml PDGF-BB regions. Statistical significance was determined by Student's t-test comparing cells in the bottom and top parts of the channel (*p<0.05).

