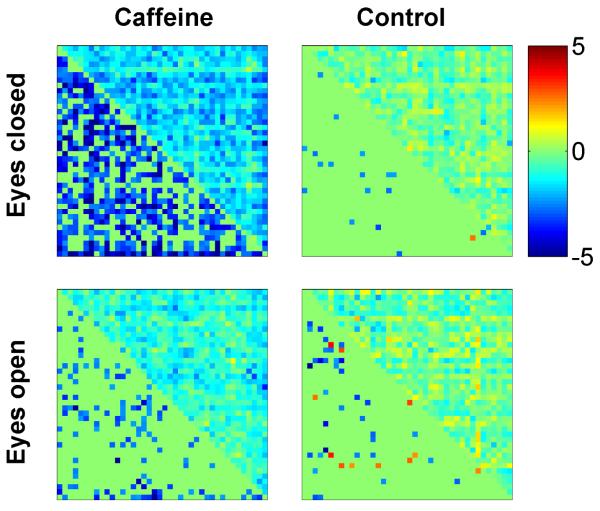
Figure 2.
Mean BOLD connectivity changes across the sample. Each subplot is divided into an upper right triangle showing the change in z-scores and a lower left triangle showing the corresponding t-statistics (entries with p>0.05 are not filled in). A negative value (blue color) corresponds to a caffeine-related decrease in connectivity.

