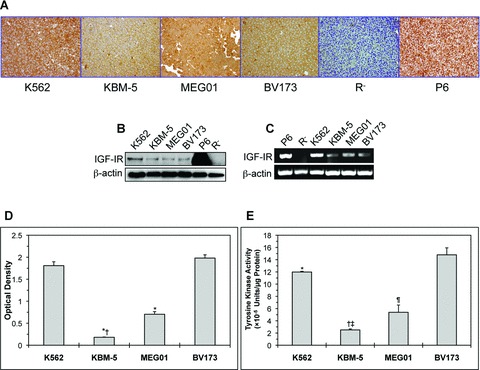
Fig 1.

Expression of IGF-IR in CML cell lines. (A) Immunohistochemical staining shows strong and universal expression of IGF-IR in four CML cell lines including K562, KBM-5, MEG01 and BV173. (B) Western blotting confirms the expression of IGF-IR protein in all of the CML cell lines. The K562 cell line demonstrates a higher level of IGF-IR protein compared with the other three cell lines. β-Actin confirms equal loading. (C) RT-PCR shows the expression of IGF-IR mRNA in CML cell lines. Similar to IGF-IR protein levels, K562 cells appear to express the highest level of IGF-IR mRNA. β-Actin supports equal loading. In all of these experiments, R− and P6 cells served as negative and positive controls for the expression of IGF-IR, respectively. (D) The KBM-5 and MEG01 cell lines demonstrate lower levels of pIGF-IR in comparison with K562 and BV173. The results represent the means ± S.D. of three experiments. *: P < 0.0001 compared with K562 and BV173 and †: P < 0.0001 compared with MEG01. (E) The KBM-5 and MEG01 cell lines possess the lowest levels of IGF-IR tyrosine kinase activity. Depicted results represent the means ± S.D. of three experiments. *: P < 0.05 compared with BV173, †: P < 0.0001 compared with K562 and BV173, ‡: P < 0.05 compared with MEG01 and ¶: P < 0.001 compared with K562 and BV173.
