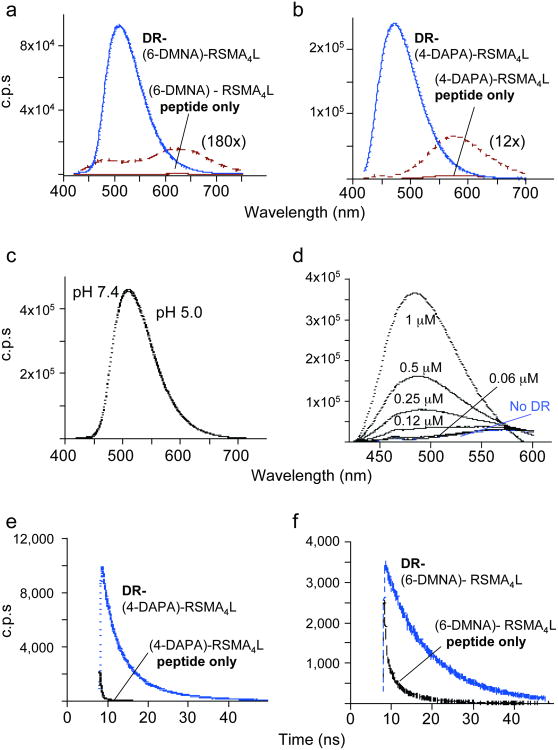
Figure 2. Spectral properties of 6-DMNA and 4-DAPA peptides free in solution and bound to DR1.
Fluorescence emission spectra of (a) (6-DMNA)-RSMA4L (20 nM) and (b) (4-DAPA)-RSMA4L (400 nM) peptides and their complexes with HLA-DR1 are shown, using 400 nm excitation. Free peptide spectra are shown also on an expanded scale. Note the shift in emission λmax upon binding of the peptide to DR and the increase in the emission intensity. Fluorescence intensities are reported as counts per second (c.p.s.). (c) The fluorescence spectrum of the purified DR-(6-DMNA) complex was recorded in citrate phosphate buffer (pH 5.0) and in PBS (pH 7.4). No difference was observed between the two pH. (d) Various concentrations of DR1 were incubated with 1 μM (4-DAPA)-RSMA4L and the emission spectra of the mixtures recorded. (f,g) Fluorescence lifetime measurements. Fluorescence lifetime is increased upon binding of the (4-DAPA)-RSMA4L (f) and (6-DMNA)-RSMA4L (g) to DR. Fluorescence lifetime values measured by time-correlation single-photon counting spectroscopy (Supplementary Table 3 online) were determined as described (Supplementary Methods online).

