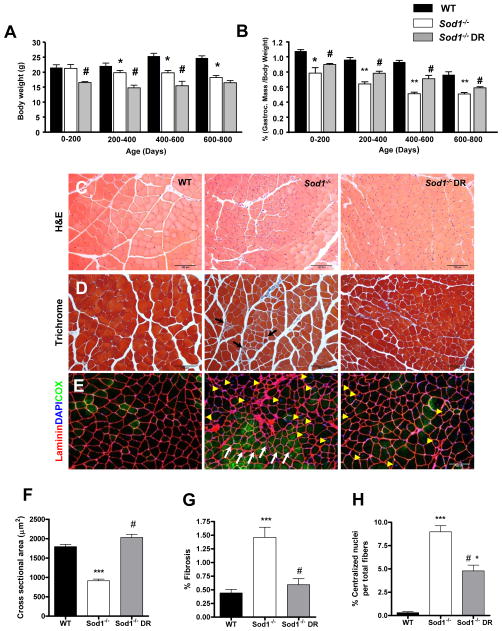
Figure 2. Dietary restriction (DR) attenuates age-related muscle atrophy and degeneration in Sod1−/− mice.
(A) Bodyweight measured throughout the lifespan (n=6–8). (B) A comparison of gastrocnemius wet weight measured throughout the lifespan (n=6–8). (C–G) A comparison of morphological features of WT, Sod1−/−, and Sod1−/− CR at 11–14 months. (C) A representative images of hematoxylin and eosin staining of gastrocnemius muscle (n=4). (D) A representative staining of Gomori trichrome staining of gastrocnemius muscle (n=4). Black arrows denote increased fibrosis. % Fibrosis is defined as the area of blue relative to red fiber area in a given field of view. 20–30 random fields of view were chosen for quantification. (E) A representative immunofluorescence staining of gastrocnemius muscle. Sarcolemma membrane is stained with anti-laminin pseudo colored in red, myonuclei are colored in blue using DAPI, and oxidative fibers are stained with anti-cytochrome c oxidase in green. White arrows represent fiber grouping and yellow arrowhead denote centralized nuclei (n=4). (F) A quantification of cross sectional area shown in (C). (G) A quantification of fibrotic area shown in (D). (H) A quantification of centralized nuclei shown in (E). WT vs. Sod1−/− ***p<0.001, Sod1−/− vs. Sod1−/− DR #p<0.05, and WT vs. Sod1−/− DR *p<0.05. All values are represented as mean ± SEM.

