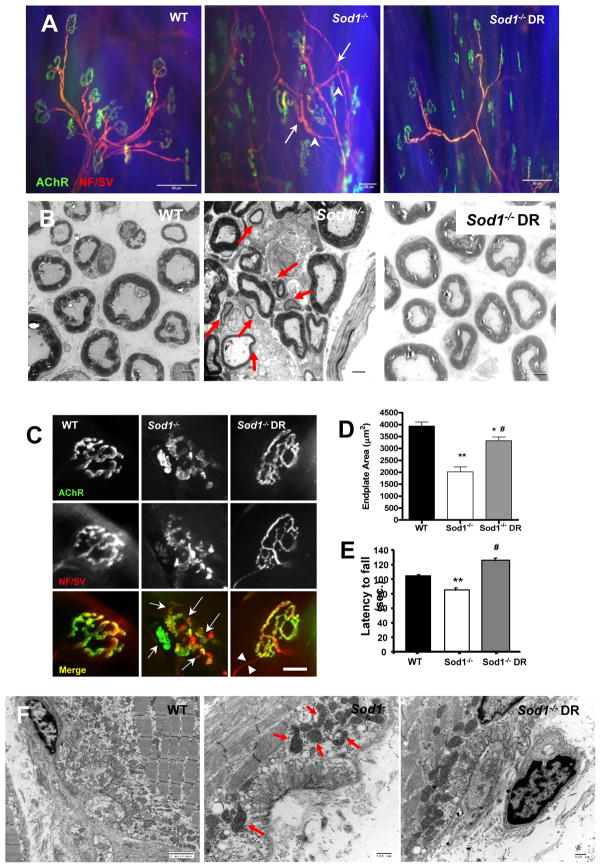
Figure 3. Dietary restriction (DR) attenuates age-related defects in neuromuscular junction (NMJ) in Sod1−/− mice.
(A) A representative images of neuromuscular junction from gastrocnemius from WT, Sod1−/−, and Sod1−/− DR at 11–14 months. Motoneuron and presynaptic nerve terminals were stained using anti-neurofilament and anti-synaptophysin (pseudo-colored in red) and postsynaptic acetylcholine receptors (AChR) were stained using fluorophore conjugated α-Bungarotoxin (pseudo-colored in green). Arrows denote sprouting of motoneuron and arrowheads denote thinning of motor neurons. (B) TEM of sciatic nerve cross section. Red arrows denote small demyelinated motor neurons. Scale bar=2μm (n=4) (C) Representative images of individual neuromuscular junctions. Arrows denote fragmentations of pre- and post-synaptic endplates. Scale bar = 20μm (D) A quantification of endplate area. At least 60 endplates and 10 random images per animal were scored blindly (n=4). Endplate size was measured by calculating the surface area that are colocalized by AChR (Bungarotoxin) and presynaptic motoneuron (neurofilament/synaptophysin) using Nikon Element software. (E) A comparison of rotarod performance at 16–18 months as measurement of overall neurological function (n=6). WT vs. Sod1−/− **p<0.01, Sod1−/− vs. Sod1−/− DR #p<0.05, and WT vs. Sod1−/− DR *p<0.05. (F) A representative electron micrograph images of gastrocnemius neuromuscular junctions at 11 months. Arrows denote abnormal subsynaptic mitochondria (n=3). All values are represented as mean ± SEM.

