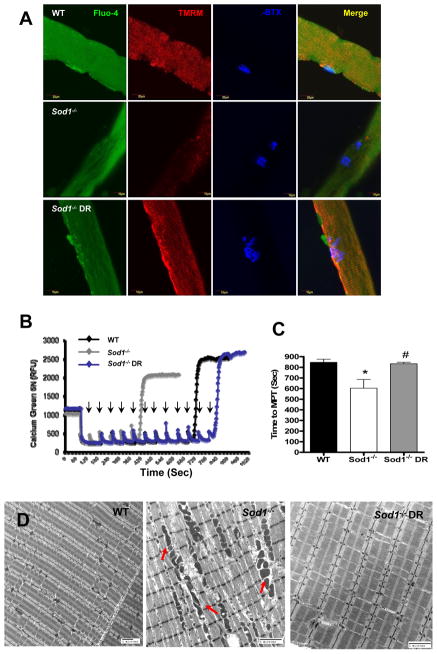
Figure 4. Dietary restriction (DR) ameliorates age-related defects in mitochondrial Ca2+ homeostasis in Sod1−/− mice.
(A) Live cell imaging from single fibers from flexor digitorum brevis (FDB) (WT in top panels, Sod1−/− middle panels, and Sod1−/− CR bottom panels). Cytosolic Ca2+ were stained with Fluo-4 (green), mitochondrial membrane potential were assessed with tetramethylrhodamine methyl esters (TMRM) stained in red, and NMJ stained in blue with α-Bungarotoxin. Merged images of three stains shown in right column. At least 20 fibers were analyzed from each animal (n=5). (B) A representative traces of calcium retention assay in mitochondria isolated from hindlimb muscle at 14 months (n=5). Arrows denote number of times Ca2+ (2μM) was added to mitochondria. (C) A quantification of time to reach mitochondrial permeability transition (MPT) (n=6). (D) A representative electron micrograph of alterations in interfibrillar mitochondria from gastrocnemius muscle at 13–14 months (n=3). WT vs. Sod1−/− *p<0.05, **p<0.01, ***p<0.001, and Sod1−/− vs. Sod1−/− DR #p<0.05.

