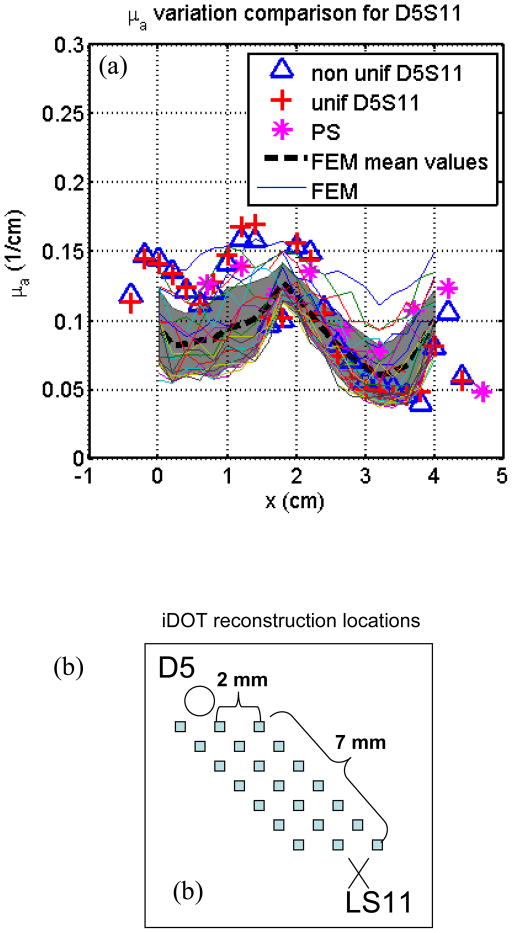
Figure 10.
Comparison with FEM reconstruction results from source 5 and detector 11. (a) FEM-reconstructed μa at different locations compared with the results by the fitting methods. Shadowing area represents mean μa values and their standard deviations along z direction. (b) The locations where the optical properties were reconstructed by FEM.

