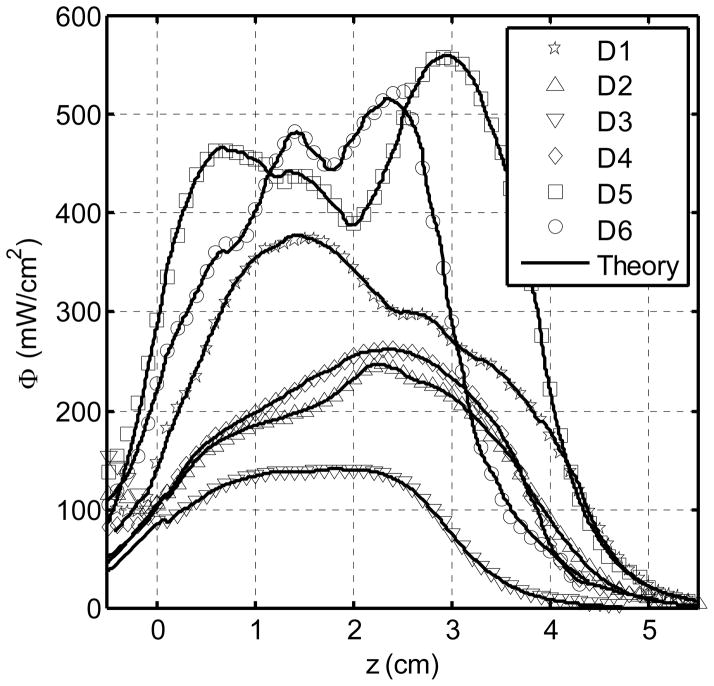
Figure 11.
Results of measured (symbols) and calculated (lines) light fluence rate at each detector locations (D1 – D6) according to Fig. 3 during PDT treatment. Each plot is the sum of the light fluence accumulated from the four adjacent channels. Each of the 12 CDFs has a uniform source strength of 100 mW/cm.

