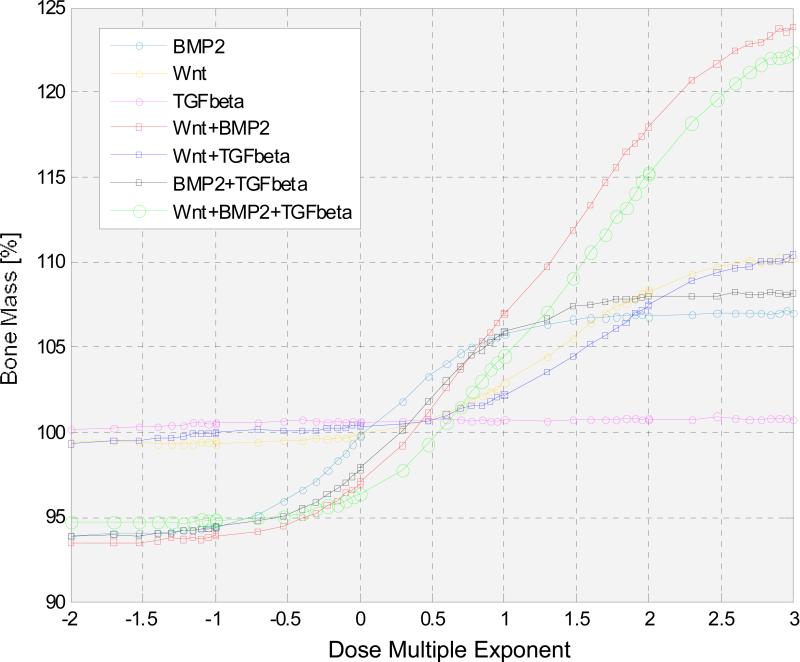
Fig. 7. The responses of bone mass to the change of concentration of cytokines in a large range from 10-2 to 103 with respect to their initial values.
X axis represents the dose multiple exponent in different therapies, Y axis represents the corresponding bone mass percentages. The combination of Wnt and BMP2 can influence the change of bone mass more than other single or combined cytokines. We also note that when the dose multiple exponent of combined Wnt and BMP2 was less than 0.3, the combined Wnt and BMP2 resulted in the decrease of the bone mass compared to its initial state.

