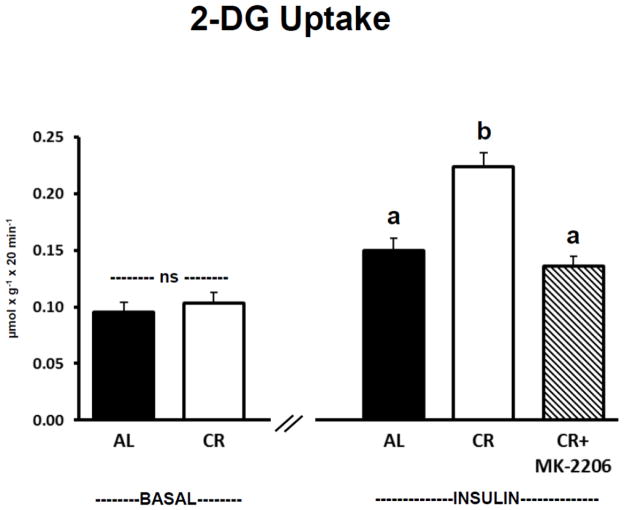
Figure 5.
2-Deoxy-D-glucose (2-DG) uptake. “ns” indicates no statistical difference between AL and CR groups in the absence of insulin. Insulin-stimulated groups with matching letters are not statistically different, and groups with differing letters are statistically (P ≤ 0.05) different from each other. Values are means ± SE, n = 9–15 per treatment group.

