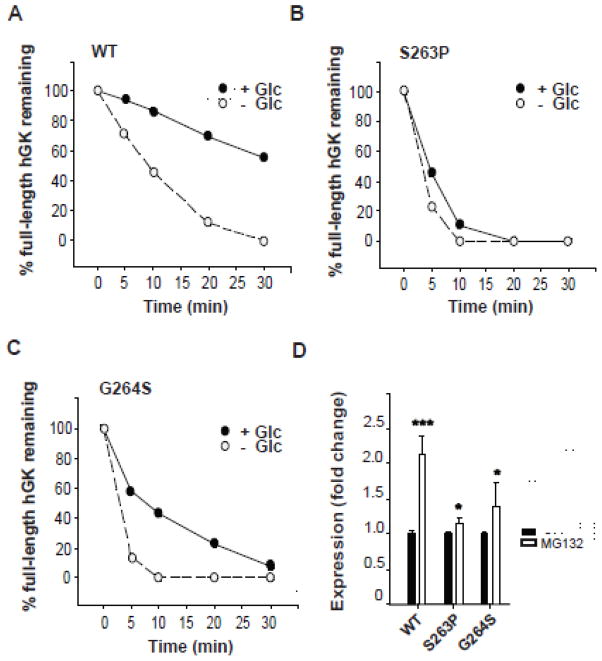
Fig. 2.
Probing protein conformations by limited proteolysis with trypsin and stability. (A–C): Time course for the limited proteolysis of WT and mutant forms by trypsin at 25 °C in the absence (white circles) and presence (black circles) of 40 mmol/l glucose. 4.5 μg of protein was removed at various time points, denatured and analyzed by SDS/PAGE (10 %), followed by Coomassie blue staining. Full-length protein was quantified by densitometric analysis and plotted as a function of time (A–C). Each time point represents the average of two individual experiments (n = 2). (D): In vitro stability of newly synthesized and partly ubiquitinated hGK forms, and the effect of the proteasome inhibitor MG132. His6-WT and -mutant forms were expressed ([35S]Met-labeled) in an in vitro coupled transcription-translation RRL system and their stability measured after 30 min at 30 °C, in the absence (black columns) and presence (white columns) of proteasome inhibitor (100 μmol/l MG132). Samples were denatured and analyzed by SDS/PAGE (10 %), autoradiography and densitometric quantification of total GK expression. Each column represents the mean ± SD of a minimum of five independent experiments (n = 5).

