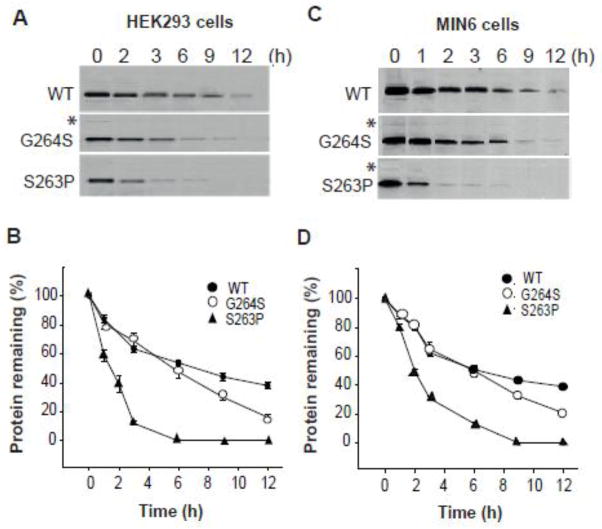
Fig. 3.
Time course of the cellular degradation of WT and mutant hGK forms. Stably transfected HEK293 cells (A and B) and MIN6 β-cells (C and D) were labeled with [35S]Met/[35S]Cys for 30 min and chased for 12 h. The recovery of WT, S263P and G264S mutant proteins was monitored by immunoprecipitation (anti-V5 Ab). Samples were denatured at 56 °C and analyzed by SDS/PAGE (4–12 %) and autoradiography (A and C). The bands of full-length V5-His tagged monomeric protein (~53 kDa) were quantified by densitometric analysis and the data plotted as a function of chase time (B and D). The mean value of triplicates at time zero was normalized to 100 % and used as a reference value. Data for each time point represents the mean ± SD of triplicates examined on three independent days (n = 9). Asterix indicates trace amount of possible dimeric forms (see Fig. 6).

