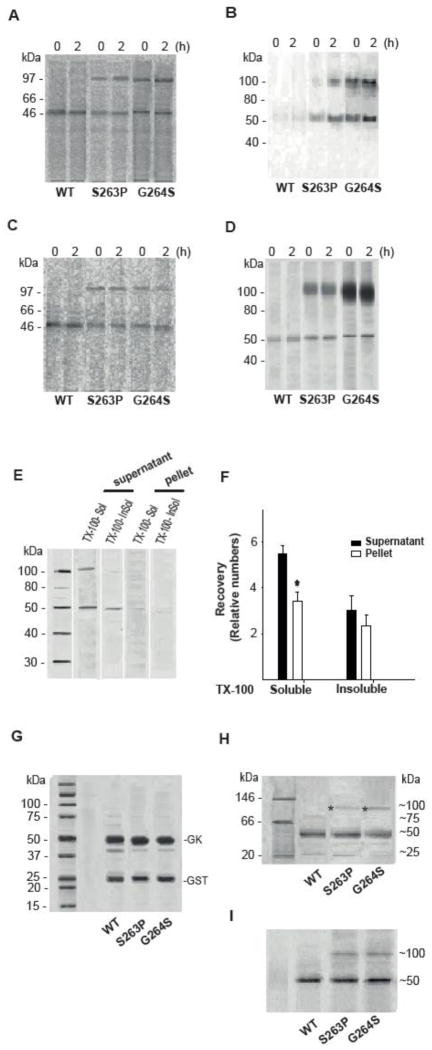
Fig. 6.
PAGE analysis of the native and denatured state of WT and mutant hGK forms over-expressed in cells and as recombinant proteins. Stably transfected HEK293 cells (A and B) and MIN6 cells (C and D) were metabolically labeled with [35S]Met/[35S]Cys for 30 min and chased for 2 h. WT, S263P and G264S mutant proteins were affinity isolated. After high-speed centrifugation of the eluate, the cytosolic fractions from HEK293 (A) and MIN6 cells (C) were analyzed by native-PAGE electrophoresis, and the pellets from HEK293 (B) and MIN6 cells (D) analyzed by SDS/PAGE (4–12 %) and immunoblotting (anti-V5 Ab) after denaturation (56 °C, 15 min). E: Analysis of Triton X-100 soluble and Triton X-100 insoluble (guanidine chloride soluble) forms of the G264S mutant protein. The post-nuclear supernatant fraction of MIN6 cells, stably expressing the G264S mutant form, was centrifuged and the recovered supernatant and pellet fractions treated with 1 % (v/v) Triton X-100. Following high-speed centrifugation, the supernatants were referred to as Triton X-100 soluble hGK protein. The resulting pellets were solubilized by sonication in 5 M guanidine chloride and high speed centrifuged (referred to as Triton X-100-insoluble (guanidine chloride-soluble) GK protein). The pellet samples were diluted 10-fold to reduce the concentration of denaturant, prior to denaturation and analysis by SDS/PAGE (4–12 %) and immunoblotting (anti-V5 Ab). (F): Densitometric quantification of immunoreactive proteins in the supernatant (black columns) and the pellet fractions (white columns) in E demonstrated more Triton X-100 soluble (supernatant > pellet) compared to Triton X-100 insoluble (guanidine chloride soluble) G264S protein (n = 3). For comparison, 10 μg of cleaved recombinant WT hGK and mutant proteins were denatured and subjected to SDS/PAGE (4–12 %) analyses and Coomassie blue staining (G), and to native-PAGE (Novex 3–12 % Bis-Tris Gel) analyses by running at 150 V for 2 h in dark blue cathode buffers followed by Coomassie blue staining (H) and by immunoblotting (anti-V5 Ab) (I). Asterix indicates dimeric forms. Monomeric and dimeric forms were quantitated by densitometric analysis (for numbers see main text) and represent the average of 3 (A–D) and 4 (H and I) experiments.

