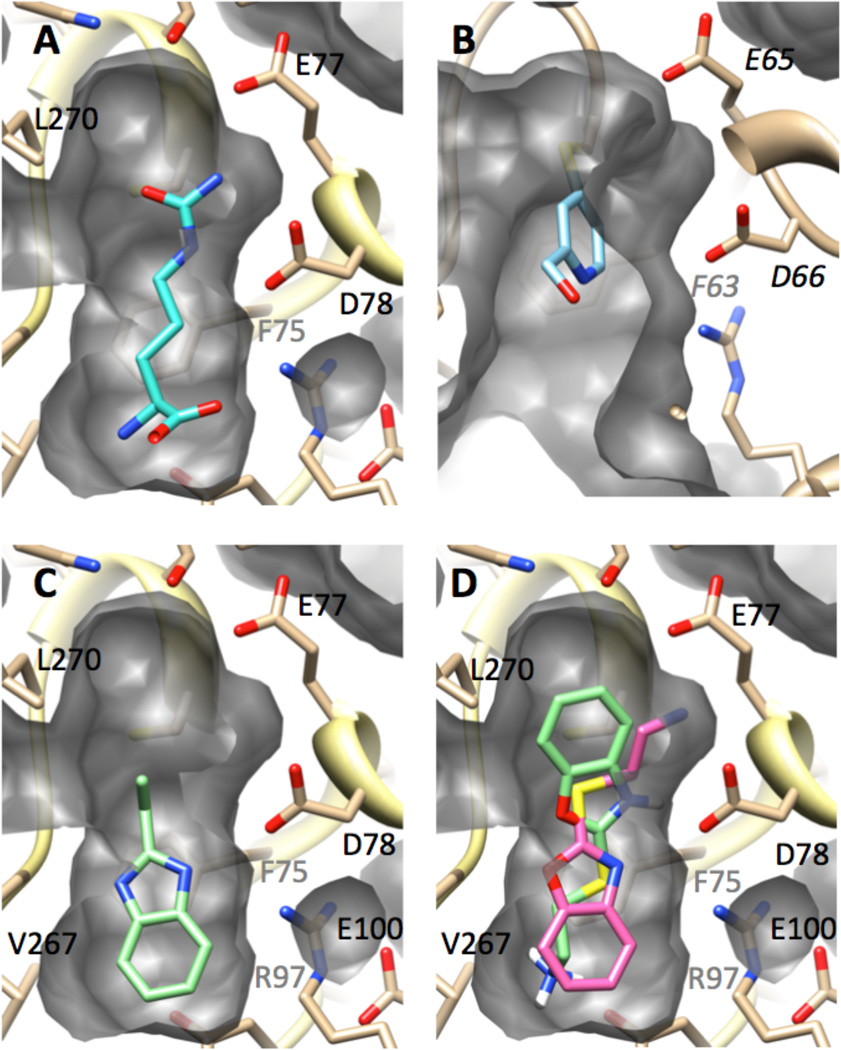
Figure 7.
Observed and modeled structures of inhibitors bound at the DDAH active site. Each panel is shown from a similar vantage point and shows a cut-away view of the active-site cavity’s surface (grey). The enzyme backbone is shown in ribbons (tan), with selected residues depicted in stick form and labeled in black or grey (if their view is obscured). Ligands are shown in stick form. Nitrogens are shown in blue, oxygens in red, sulfur in yellow. A) X-ray structure of l-citrulline (cyan) bound to human DDAH-1.10 B) X-ray structure of P. aeruginosa DDAH after inactivation by 11 (light blue).38 C) Modeled structure of human DDAH-1 bound to 12 (light green). D) Modeled structure of human DDAH-1 bound to 13 in two poses (light green, pink). See Experimental Procedures and Results and Discussion for details.

