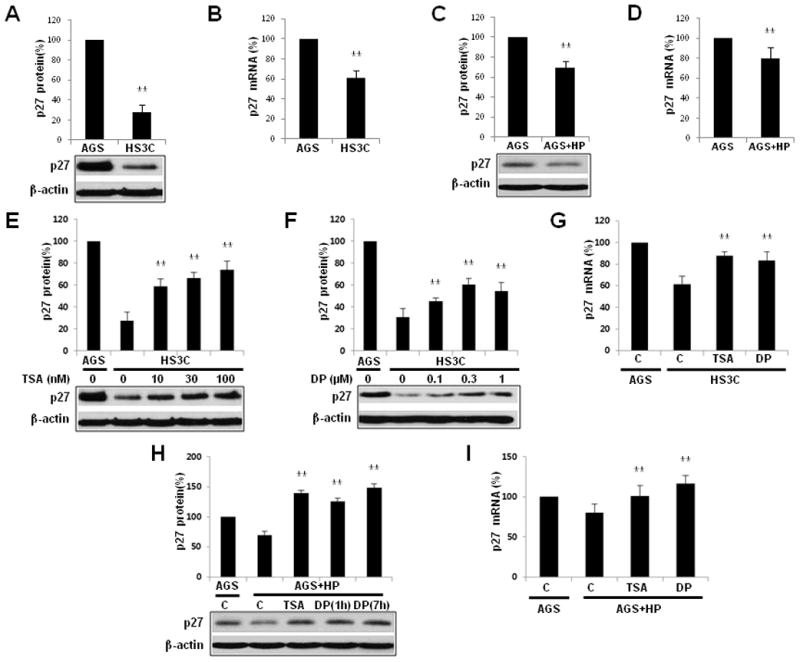
Fig. 1.

Downregulation of p27 mRNA and p27 expression by H. pylori infection and by treatment with trichostatin A (TSA) and DPDPE (DP). A comparison of steady-state p27 (A) and p27 mRNA (B) expression in HS3C cells relative to AGS cells. The effects of H. pylori infection on p27 (C) and p27 mRNA (D) in AGS cells that were acutely infected with H. pylori. Following treatment with increasing doses of TSA (E) for 6 h and DPDPE (F) for 1 h, p27 expression levels in HS3C cells were measured by immunoblot analyses. The expression of p27 mRNA was analysed by real-time quantitative PCR in HS3C cells with or without treatment of TSA and DPDPE (G). AGS cells that were infected with H. pylori for 6 h were treated with 100 nM TSA and 0.3 μM DPDPE for the times indicated. The immunoblot analysis for endogenously expressed p27 was conducted using an anti-p27 antibody (H). The expression of p27 transcripts in AGS cells following H. pylori infection and treatment with TSA for 6 h and DPDPE for 1 h was analysed by real-time quantitative PCR (I). The levels of p27 were quantified and normalised to actin via Western blotting. 18S rRNA was used as a control in the RT-qPCR experiments. The data represent the mean ± SD of 3 independent experiments with **P < 0.01 versus the corresponding control.
