
Figure 2.
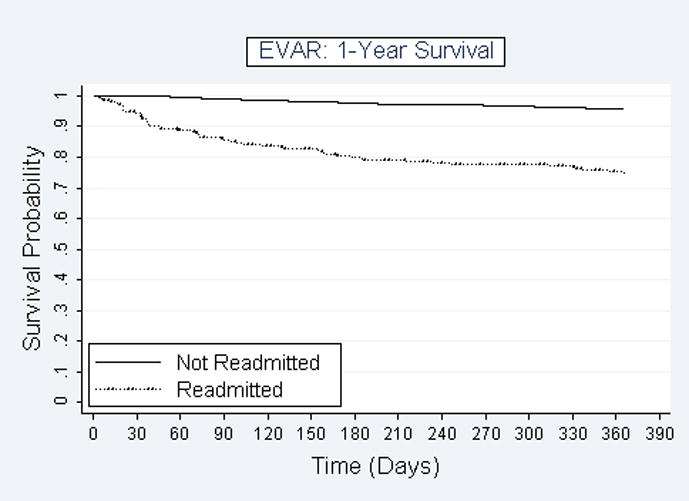
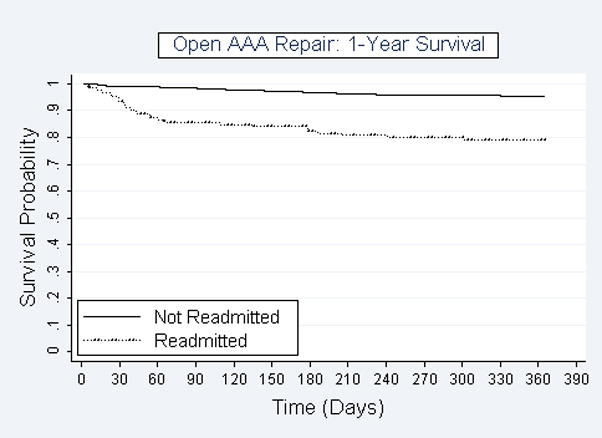
Figure 2a. Kaplan-Meier survival curves for patients who were readmitted (n=200) or were not readmitted (n=1302) after endovascular AAA repair. Y-axis displays probability of survival and X-axis shows days after surgical discharge.
Figure 2b. Kaplan-Meier survival curves for patients who were readmitted (n=125) or were not readmitted (n=854) after open AAA repair. Y-axis displays probability of survival and X-axis shows days after surgical discharge.