Figure 2.

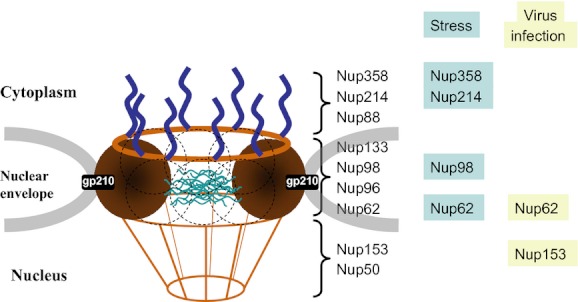
Schematic representation of the mammalian NPC. The relative position of various Nups is listed. The Nups altered by cellular stresses and virus infection are indicated in blue and yellow, respectively.

Schematic representation of the mammalian NPC. The relative position of various Nups is listed. The Nups altered by cellular stresses and virus infection are indicated in blue and yellow, respectively.