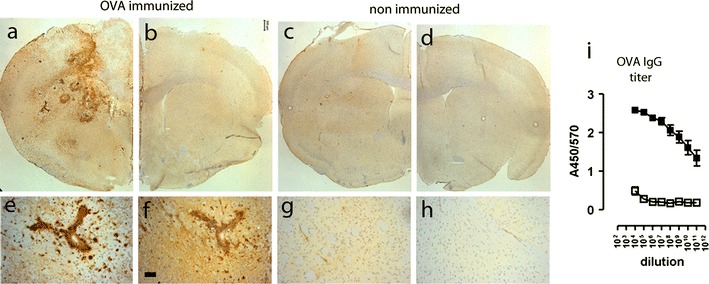
Fig. 1.

Accumulation of OVA and IgG following intracerebral injection of OVA. OVA-immunized mice (a, b, e, f) or non-immunized mice (c, d, g, h) received a unilateral injection of OVA into the striatum and were assessed for the presence of OVA and IgG 24 h later. Immunocytochemical analysis of OVA revealed accumulation of OVA at the injected site of the brains of immunized mice (a) and not in the injected site of the brain of non-immunized mice (c). The non-injected hemisphere of the brain of both immunized (b) and non-immunized mice (d) were negative for OVA immunoreactivity. Scale bar 300 μm. A higher magnification shows accumulation of OVA in association with and around blood vessels of OVA-immunized mice (e) but not in non-immunized mice (g). Immunocytochemical staining of IgG showed extravasation from blood vessels in OVA-immunized mice (f) but not in non-immunized mice (h). Scale bar 50 μm. Representative data of n = 3 per treatment group is shown. The experiment was performed twice independently with comparable results. i Levels of circulating anti-OVA antibodies (total IgG) were determined by ELISA. Data is expressed as A450/570 values. Closed symbols and represent OVA-immunized mice (n = 14) and open symbols represents non-immunized mice (n = 3)
