
Fig. 3.
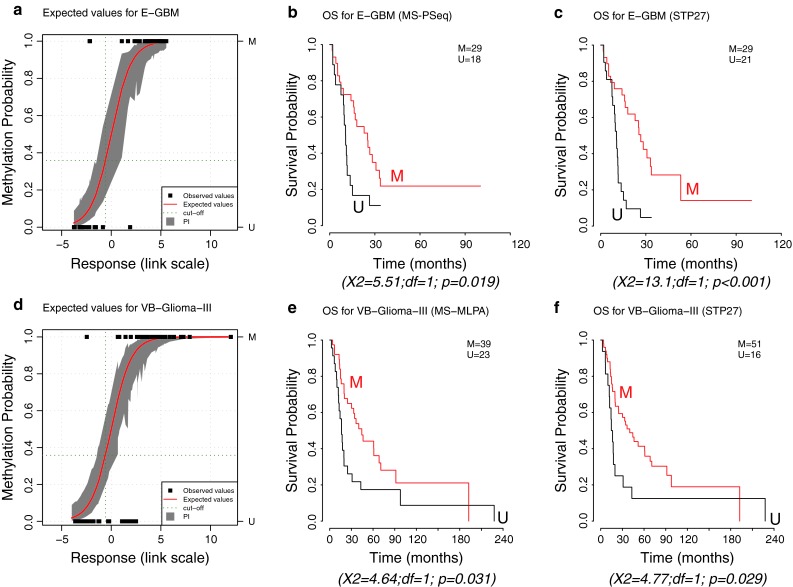
Validation of MGMT-STP27 in external datasets. The plots a and d represent the estimated probability of methylation against logit-transformed response fitted for the E-GBM, and VB-Glioma-III datasets using STP27. Fitted values and their prediction intervals [PI] at 95 %, estimated by simulation, correspond to the red line and gray area, respectively. Dark green dotted lines indicate the threshold used to define methylated and unmethylated samples according to STP27. The observed values are visualized by full black squares, indicating same or different classification by STP27 or MS-PSeq for E-GBM and MS-MLPA test for VB-Glioma-III, respectively. The Kaplan–Meier curves are based on classification by MS-PSeq for E-GBM (b), the MS-MLPA test for VB-Glioma-III (e), and based on the respective predicted methylation status using MGMT-STP27, in (c, f). Results of log-rank tests are given below each survival representation. M methylated, U unmethylated