
Fig. 2.
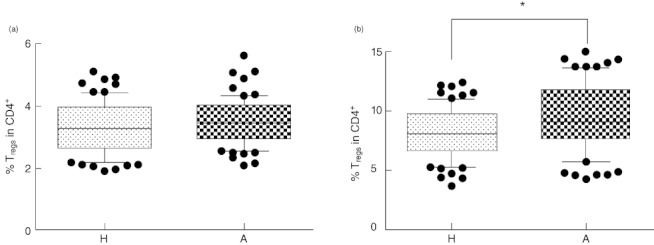
Proportion of regulatory T cells (Tregs) in cord blood. (a) Four-colour flow cytometry analysis (intercept of CD4+CD25highCD127low and CD4+CD25high forkhead box protein 3 (FoxP3+) and CD4+CD127lowFoxP3+. (b) Two-colour flow cytometry analysis (CD4+CD25+). H: proportion of Tregs in CD4+ lymphocytes in cord blood of children of healthy mothers (mean of 77 tested cord blood samples). A: proportion of Tregs in CD4+ lymphocytes in cord blood of children of allergic mothers (mean of 76 tested cord blood samples). *P ≤ 0·05.