
Fig. 1.
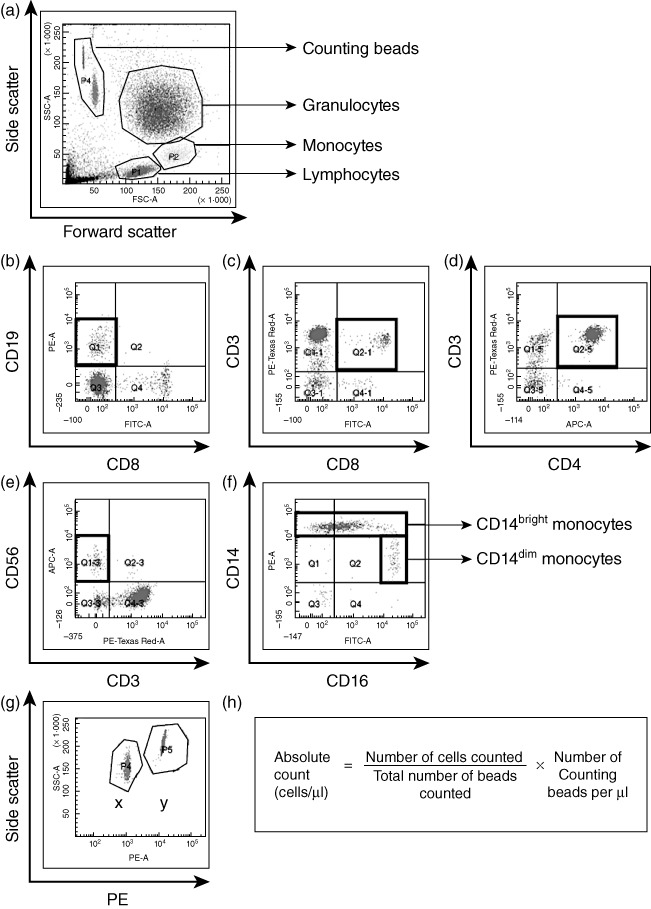
Basic gating strategy for absolute cell count analysis. (a) Cells were gated on forward/side scatter (FSC/SSC). The thick black boxes show cell populations measured. Isotype control antibodies were used to define negative populations and single-stained samples were tested to ensure that fluorochromes were well compensated. (b) CD19+CD8−B cells, (c) CD3+CD8+ T cells, (d) CD3+CD4+ T cells and (e) CD3-CD56+ natural killer (NK) cells were gated within the lymphocyte gate on the FSC/SSC. (f) CD14+ monocytes were gated within the monocyte gate on the FSC/SSC and subdivided into CD14bright and CD14dim. (g) Counting beads were displayed on a SSC/phycoerythrin (PE) plot to distinguish clearly the two populations of beads, labelled as X and Y. The proportion of the bead populations acted as an internal control. (h) Example calculation of absolute cell counts.