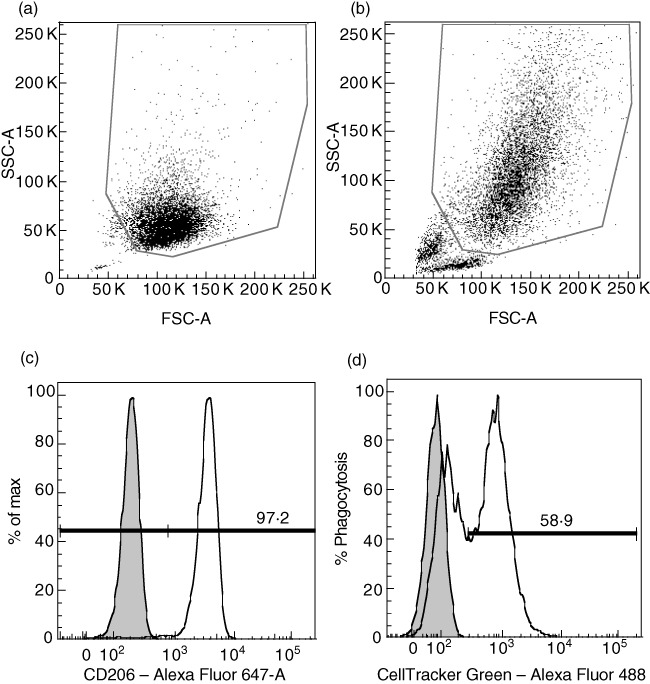
Fig. 2.

Example of flow cytometry results for phagocytosis experiments. (a) Forward-/side-scatter (FSC/SSC) gate showing control with only monocyte-derived macrophages (MØs). (b) FSC/SSC gate showing MØs that have engulfed apoptotic Jurkat cells. (c) From the FSC/SSC gate, cells are further gated for the MØ-specific marker CD206. Filled histogram represents unstained cells without apoptotic cells. (d) Percentage of CellTracker™ Green-stained cells out of CD206-positive cells is used as a measure of phagocytosis. This represents an experiment where healthy blood donors (HBD) MØs were allowed to feed on apoptotic Jurkat cells at a MØ : Jurkat ratio of 1:2 during 1 h. Filled histogram represents control cells that did not engulf any apoptotic cells and were single-stained for CD206.
