Figure 6.
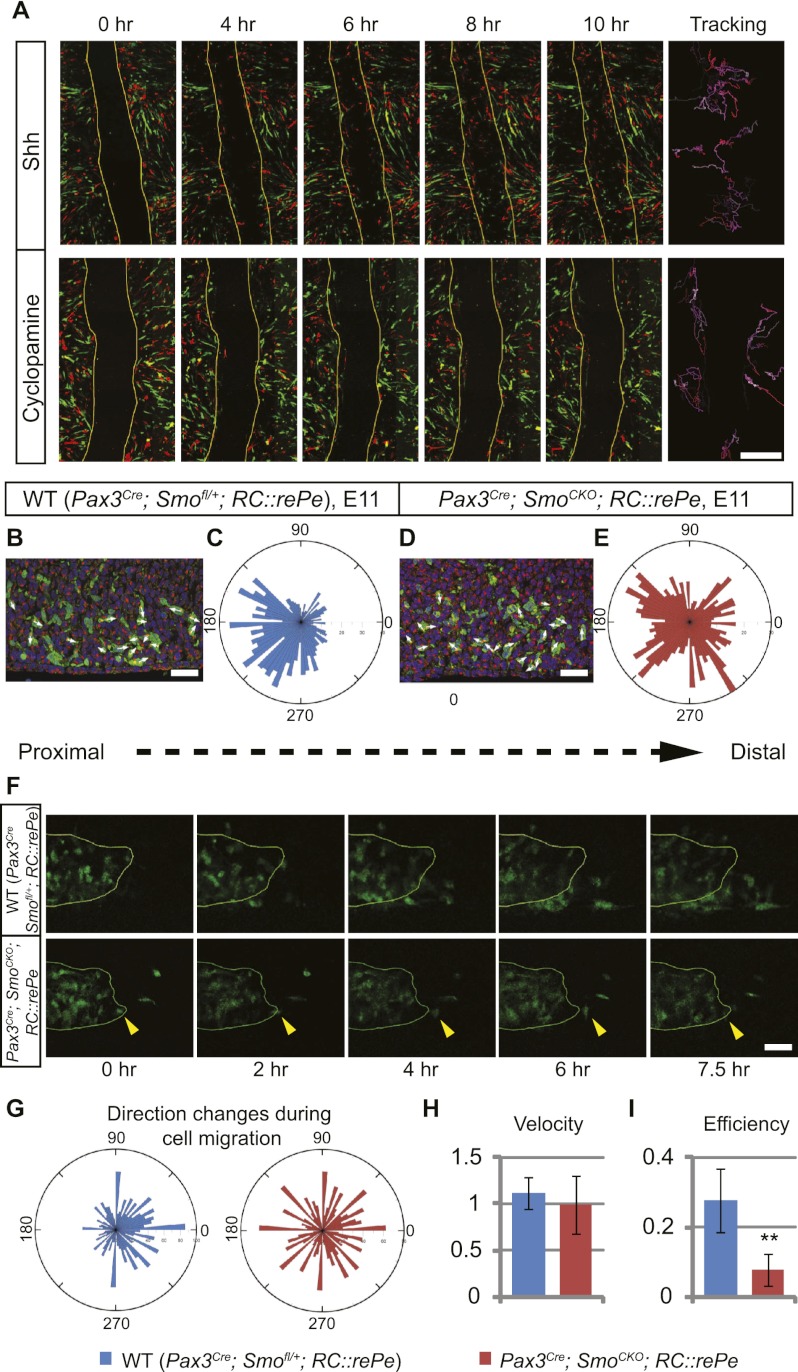
Cell-autonomous Hh activity is required for the migration of distal limb muscle cells. (A) Scratch assays were performed to test the requirement of Shh for cell migration. Confluent chick primary muscle cells were labeled with either GFP or DsRed and cultured in the presence of Shh or cyclopamine. Time-lapse images showed that in the presence of Shh, cells began to move into the stripe at the fourth hour and closed the gap by the eighth hour. When Shh signaling was blocked by cyclopamine, cells continued to move but failed to close the gap. Cell movement was tracked, with the beginning of the migration coded white and the subsequent movements coded with increasing red intensity. (B,D) Sections of E11 mouse ventral limbs (distal to the right) were analyzed for the position of the Golgi complex (marked by GM130 antibody, red) relative to the nucleus (DAPI, blue) in Pax3 descendants (GFP antibody, green). White arrows indicate the directions of cell movements. (C,E) The relative position of the Golgi to the nucleus was measured as the angle between the Golgi/nucleus alignment and the proximal–distal axis. The numbers of Golgi complexes at a particular angle were quantified and binned at a 5°-interval, as represented on the rosette graph. (C) In the wild type (WT), the majority of the Golgi complexes were positioned in the proximal half, indicating distal movements (n = 1157 cells from three individuals). (E) In contrast to this, Golgi complexes of muscle progenitor cells that had lost Hh activity were more randomly distributed (n = 1043 cells from three individuals). This difference is statistically significant, with a χ2 value of 136.312; P < 0.00001. (F) Time-lapse images of E11 limb tissue slices showed that GFP-positive Pax3 descendants in the wild-type embryos migrated distally, while Pax3Cre; SmoCKO; RC∷rePe mutant myogenic cells did not. In a few cases where cells did migrate distally, they often retracted in the end (yellow arrowheads). (G) Cells were tracked, and the angle of turning between each frame was quantified, showing that wild-type cells (n = 22) tended to turn toward the distal end of the limb, while mutant cells (n = 19) turn randomly. This difference is statistically significant, with a χ2 value of 166; P < 0.00001. (H,I) The velocity and efficiency (i.e., ratio between actual displacement and total distance traveled) of these cells were also quantified, showing that while Hh signaling does not affect muscle cell speed, it modulates its migration efficiency. Histograms are expressed as means and standard error of the mean (SEM). (**) P < 0.01. Bars: A, 500 μm; B,D, 30 μm; F, 40 μm.

