Figure 1.
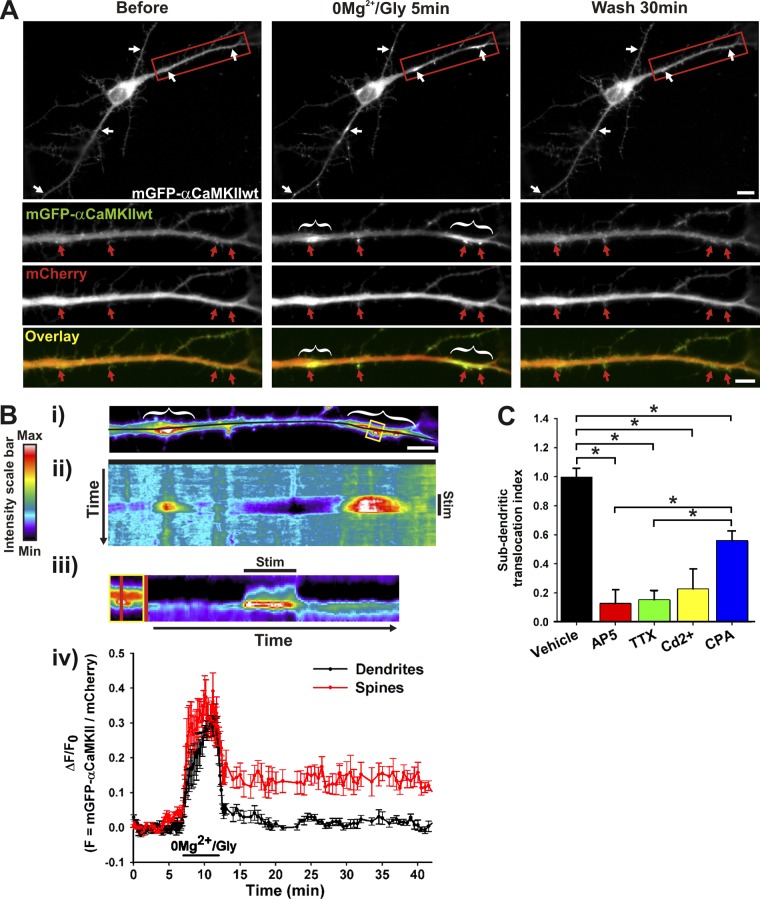
Activity-dependent translocation of αCaMKII to dendritic sites near synapses. (A) Hippocampal neuron (12 DIV) expressing mGFP-αCaMKII and mCherry imaged before, during, and after stimulation with 0Mg2+/Gly for 5 min. (B, i) Pseudocolor image from dendrite in A. Kymograph (ii–iii) and time-lapse (iv) analyses of the change in the fluorescent intensity ratio (mGFP-αCaMKII/mCherry) over time across the dendrite (i–ii, black line) and across the spine (iii, yellow box, red line). Stimulation period is indicated (Stim). (iv) n = 4 spines and subdendritic regions from the neuron shown in A. Red and white arrows (or brackets) point, respectively, to synaptic and dendritic sites where CaMKII translocated. Bars: (neuron) 10 µm; (dendrite) 5 µm. (C) Normalized ratio (±SEM) of dendritic segment where mGFP-αCaMKII accumulated over total dendritic length after a 5-min 0Mg2+/Gly stimulation (Vehicle), in the presence of 50 µM AP5, 1 μM TTX, 10 μM Cd2+, or 10 μM CPA. n = 7–24 neurons per condition. *, P < 0.05 Kruskal-Wallis followed by Tukey’s least-significant difference test. See also Fig. S1, Fig. S2, and Videos 1–3.

