Figure 5.
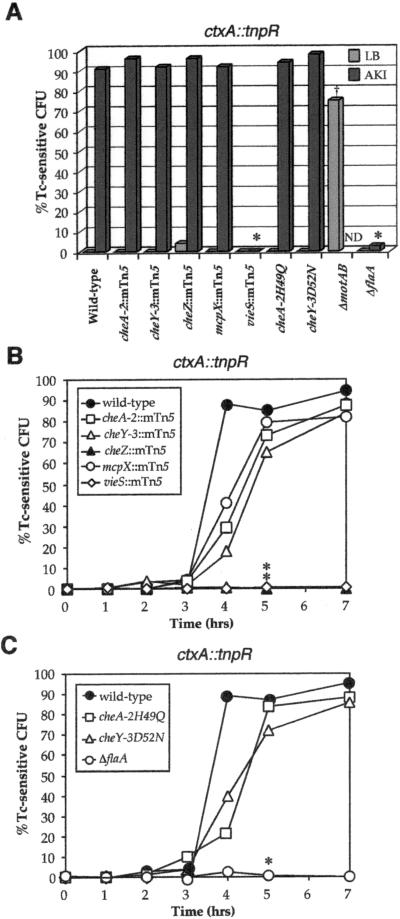
Induction patterns of the ctxA∷tnpR fusion in various strain backgrounds in vitro and during infection. (A) The induction of ctxA∷tnpR was determined as described in the Fig. 3 legend. †, Percentage of Tc-sensitive cfu for the ΔmotAB strain was determined by testing 16 independently constructed strains for Tc sensitivity. ND, induction with the ΔmotAB strain in AKI broth was not tested because of constitutive activity of the ctxA∷tnpR fusion in this strain background. Strains with reduced induction of the gene fusion compared with wild-type (P < 0.01) are denoted by asterisks. (B and C) The induction kinetics of ctxA∷tnpR during infection were determined and statistically analyzed as described in the Fig. 3 legend. Strains with reduced induction of the gene fusion compared with wild type (P < 0.02) are denoted by asterisks.

