Figure 10.

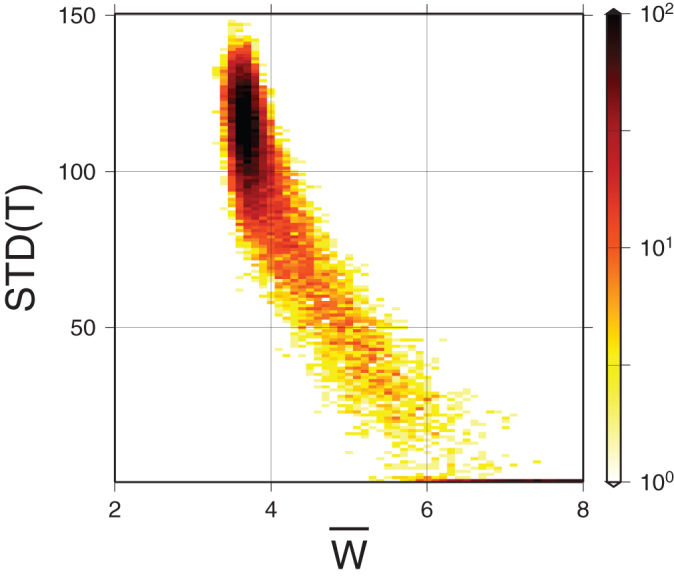
The 2D histogram of links time delay variation, STD(Tl,r) and links average strength,  . This 2D histogram is for network located at zone 1 and based on temperature measurements at 850 hPa isobar.

The 2D histogram of links time delay variation, STD(Tl,r) and links average strength,  . This 2D histogram is for network located at zone 1 and based on temperature measurements at 850 hPa isobar.