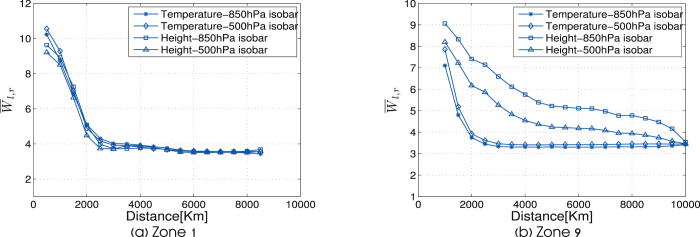
Figure 4. The dependence of  on Dl,r in two typical locations.
(a) Zone 1 (off–equatorial region). (b) Zone 9 (equatorial region). The four curves describe four networks which are based on geopotential height measurement at 850 and 500 hPa isobar and based on temperature measurement at 850 and 500 hPa isobar.

