
Table 4.
Permutation test of some results in Table 2.
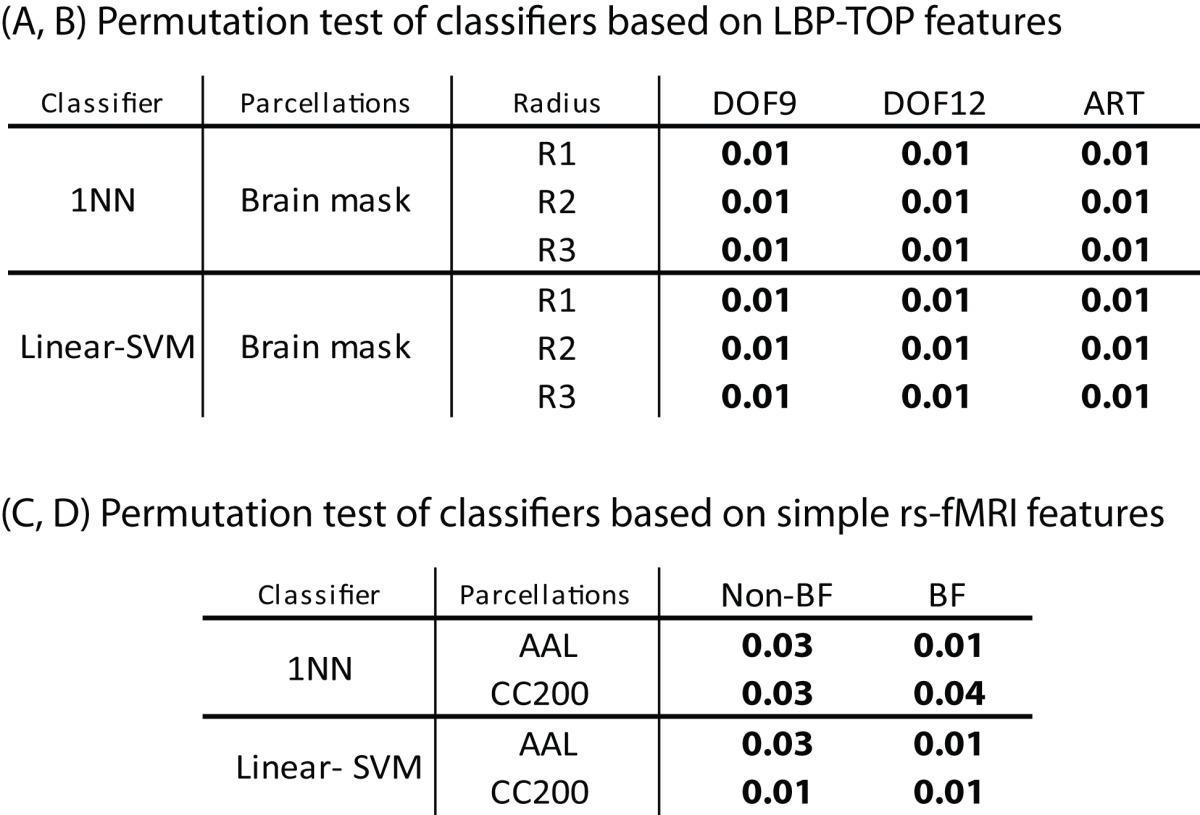 |
The p-values are calculated over 100 randomized sets of each test. The error of each set was estimated by same 10-fold cross-validation of data. Bold p-values correspond to significant results (p-value < 0.05).