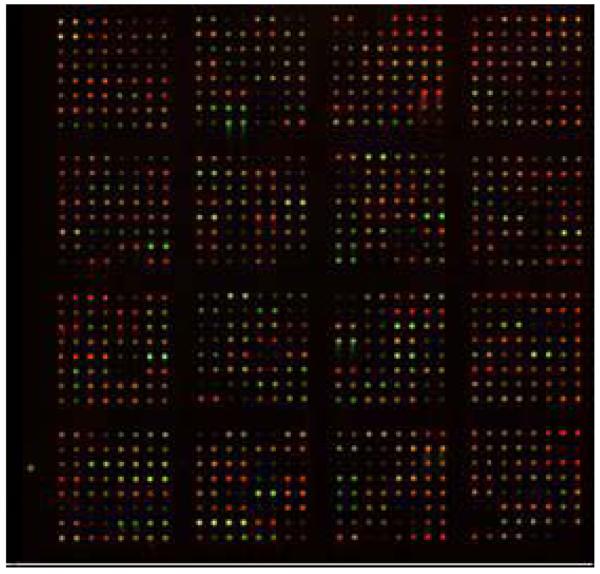
Figure 1. Array image of urine from kidney transplant patient differing in graft survival vs. normal controls.
Proteins from kidney transplant urine (experimental) vs. normal kidney urine (control) were labeled with Cy3 or Cy5 dyes, respectively, and analyzed on an antibody microarray platform. Green features or red features indicate net increases for either condition. Yellow features indicate equivalent amounts of protein in both samples.

