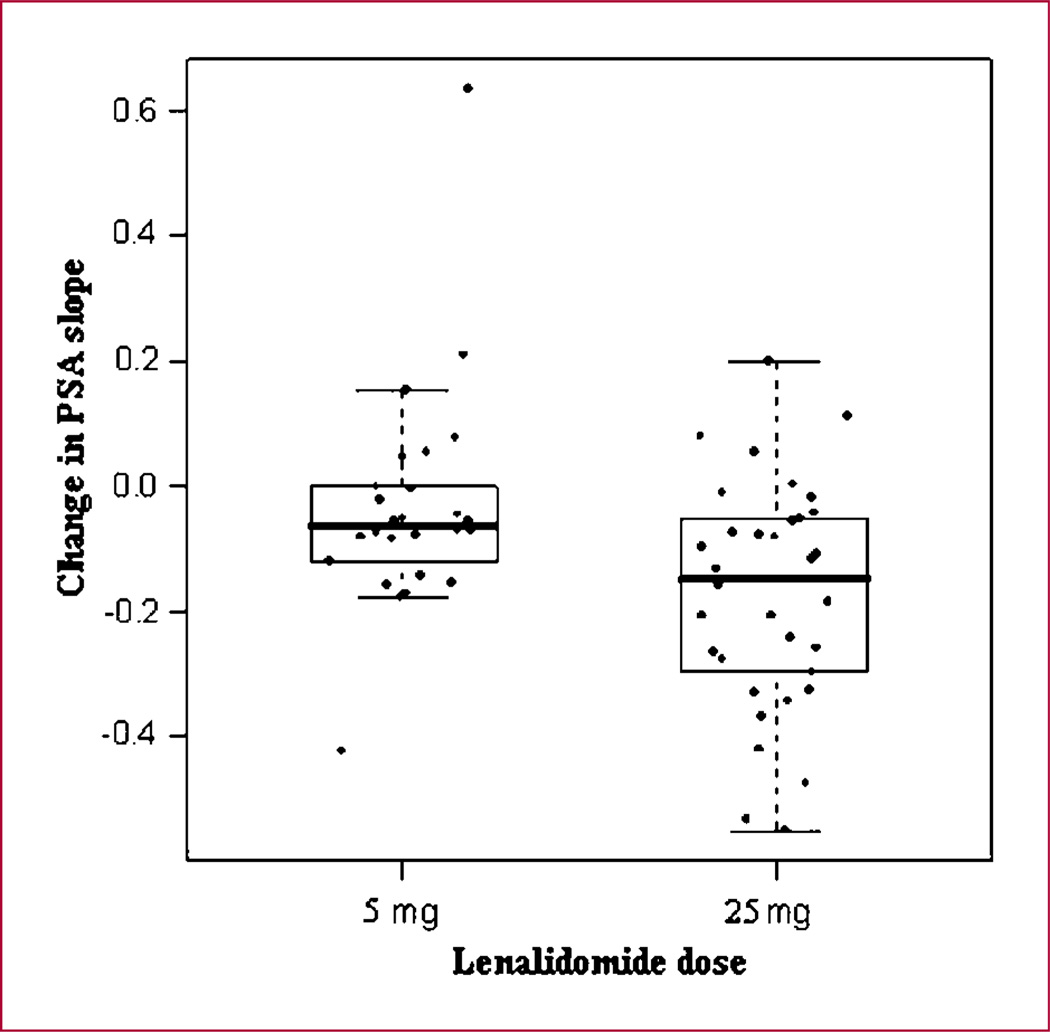
Fig. 2.
Changes of PSA slope in the two dose groups of lenalidomide. *, the length of the box is the spread of the middle 50% of the observations. The line inside each box is the median. The lines extend to the upper quartile plus 1.5 times the interquartile range and the lower quartile minus 1.5 times the interquartile range.

