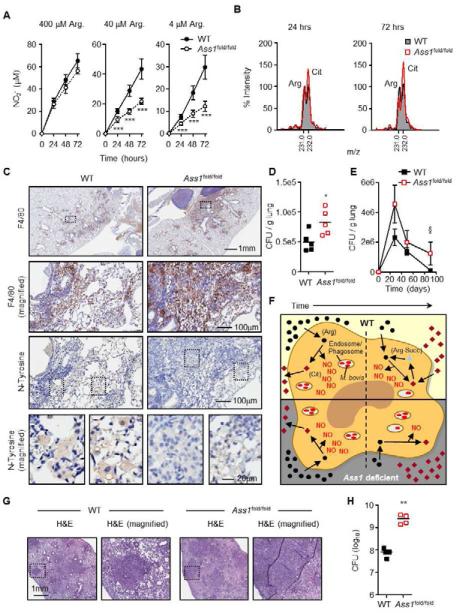
Figure 5. Ass1 is required for optimal NO output and control of infection in vivo.
(A and B). BMDMs from WT or Ass1fold/fold bone marrow chimeras (n = 3) were cultured in media with 400 μM, 40 μM, or 4 μM arginine and stimulated for the indicated times with LPS + IFN-γ. Culture supernatants were assayed for NO production (A) and relative amino acid levels by MS (B). Data in (B) are from cells cultured in 40 μM arginine and are normalized to WT arginine levels equal to 100% at each time point. Error bars, SD.(C and D). WT and Ass1fold/fold bone marrow chimeras (n = 6) were infected with an intranasal dose of M. bovis BCG containing 2-5×10⁵ CFUs. 4-5 weeks following infection, lungs were analyzed by immunohistochemistry (C), and homogenized to determine CFUs (D). Data are representative of 3 experiments. (E). WT and Ass1fold/fold bone marrow chimeras (n = 3 per time point) were infected with an intranasal dose of M. bovis BCG containing ~10×106 CFUs. Lungs were homogenized at the indicated timepoints to determine CFUs. Data are from 1 experiment. Error bars, SEM. (F) Model of macrophage NO production via Ass1-mediated citrulline metabolism. In infected macrophages, either WT (top) or Ass1-deficient (bottom), extracellular arginine is preferentially utilized to generate NO via iNOS, and citrulline is exported. Over time, arginine becomes limiting, and WT macrophages utilize Ass1-mediated citrulline metabolism to regenerate arginine as a secondary source for NO production – a mechanism that is lost in Ass1-deficient macrophages, resulting in decreased NO levels and increased bacterial load.
(G and H) WT (n = 5) and Ass1fold/fold (n = 4) bone marrow chimeras were infected with an aerosol dose of M. tuberculosis containing ~ 100 CFUs. Mice were sacrificed 4 weeks post-infection and lungs were analyzed by histology (G) and homogenized to determine CFUs (H). Data are from 1 experiment.
Error bars, SD (SEM in E). *** p < 0.001, ** p < 0.01, * p < 0.05 by Student's t test. § p < 0.05 by two-way ANOVA.
See also Figure S5.

