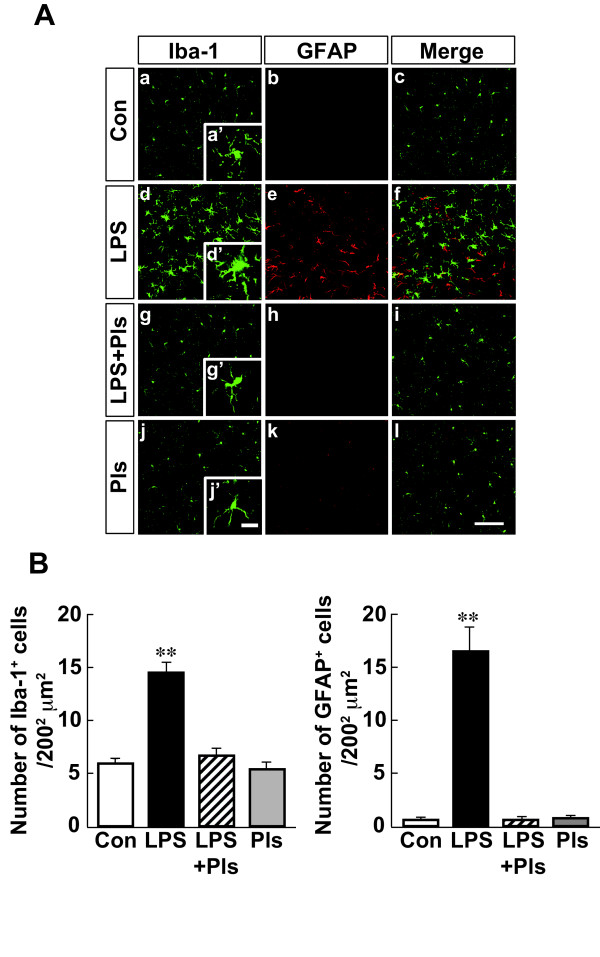
Figure 2.
Activation of glial cells in the murine PFC following LPS injection (i.p.) performed on seven consecutive days and suppression by Pls applied immediately after each LPS injection. A, Iba-1-positive microglia (green) and GFAP-positive astrocytes (red). The number and intensity of immunoreactivity of microglia increased after LPS treatment (d) with hypertrophy (d’) compared with that observed in the Con group (a and a’) and was suppressed by application of Pls (g and g’). The Pls group (j and j’) showed no differences from the Con group. GFAP-positive astrocytes also demonstrated increases in number and intensity due to LPS and suppression by Pls (middle column). Iba-1 and GFAP immunostaining did not merge with each other (f). Scale bar: low magnification, 100 μm, and high magnification, 20 μm. B, A summary of LPS-induced increases in the numbers of microglia (left) and astrocytes (right) and suppression by Pls (each bar, n = 8). **, P <0.01, respectively. Con, control; GFAP, glial fibrillary acidic protein; LPS, lipopolysaccharide; PFC, prefrontal cortex; Pls, plasmalogens.

