Figure 1 .
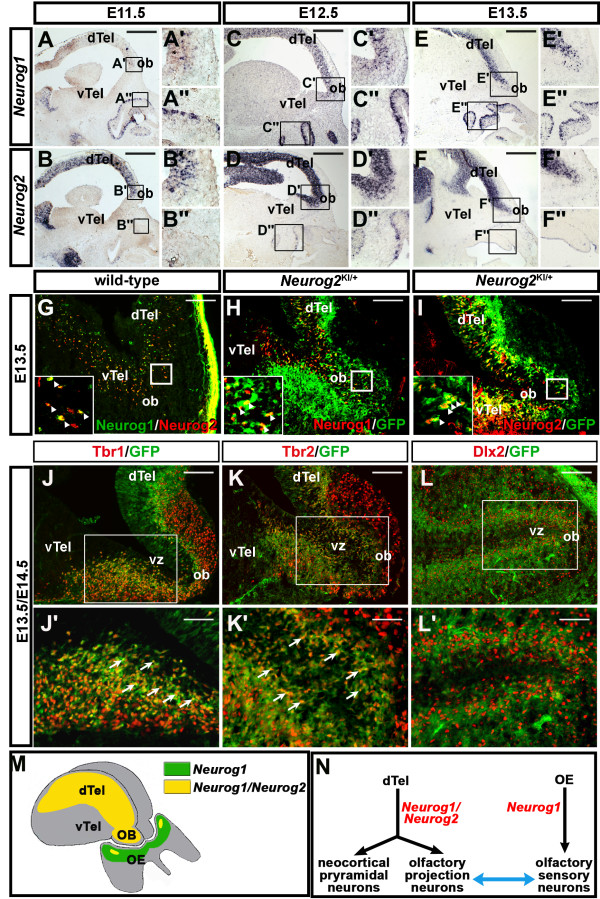
Neurog1 and Neurog2 expression in the embryonic olfactory system. (A) to (F) Sagittal sections of embryonic day (E) 11.5, E12.5 and E13.5 embryos, showing the distribution of Neurog1 (A-A", C-C", E-E") and Neurog2 (B-B", D-D", F-F") transcripts. Insets in A to F are fourfold magnifications of the boxed areas in the OB (A' to F') and OE (A" to F"). (G) to (I) Co-immunolabeling of E13.5 Neurog2 KI/+ brains with antibodies to Neurog1 and Neurog2 (G), Neurog1 and GFP (H), and Neurog2 and GFP (I). Insets in (G) to (I) are fourfold magnifications of the boxed areas. (J) to (L) Co-immunolabeling of the E13.5 OB with Tbr1 and GFP (J,J') and with Tbr2 and GFP (K,K'), and labeling of the E14.5 OB with Dlx2 and GFP (L,L'). Boxed areas in (J) to (L) are magnified twofold in J', K', L' respectively. (M) Schematic representation of Neurog1 single-positive OE progenitors (green) and Neurog1/Neurog2 double-positive progenitors (yellow) in the OB and a small region of the OE. (N) Schematic illustration of the objectives of this study; to determine the roles of Neurog1 and Neurog2 in olfactory system development. dTel, dorsal telencephalon; OB, olfactory bulb; OE, olfactory epithelium; vTel, ventral telencephalon. Scale bars: 1 mm (A) to (F), 250 μm (G) to (L), 125 μm (J') to (L').

